Table of Contents
How To Measure Project Profitability? Project Profitability Analysis
Estimating project profitability is essential for determining whether a project delivers the financial outcomes it promised initially.
This process involves evaluating various financial metrics, including net profit, return on investment (ROI), and profit margins. These metrics collectively offer a thorough view of a project’s financial performance.
Here’s why measuring project profitability matters for various strategic decisions:
Reason | Explanation |
Ensures the project contributes to financial health | Ensures that the project positively impacts the overall financial well-being of the business. |
Provides insights into resource efficiency | Helps assess how effectively resources are being used throughout the project. |
Aids in decisions about continuing or scaling projects | Assists in making informed decisions on whether to continue, halt, or expand a project. |
Evaluates performance against financial goals | Measures how well the project is performing in relation to the company’s financial objectives. |
Boosts investor confidence and attracts investment | Demonstrates profitability, which can enhance investor trust and attract additional funding. |
Maintains a competitive edge by focusing on high-return projects | Keeps the business competitive by prioritizing projects with the highest returns. |
The article will discuss the following methods to measure project profitability.
- Using a project management software
- Using formulas
What Is Project Profitability?
Project profitability evaluates the efficacy with which a project achieves a positive return on investment (ROI) and fulfills its financial targets.
This assessment entails a comprehensive analysis of the project’s total revenue concerning the aggregate costs incurred during its execution.
A project is profitable if its revenue surpasses the total expenditures, yielding a positive net present value (NPV).
What Is Project Profitability Analysis?
Project profitability analysis assesses a project’s financial viability by examining its financial metrics to gauge its potential profitability. This involves thoroughly evaluating financial data to ensure the project meets objectives and yields a favorable ROI.
This analytical process is critical for providing actionable insights that guide:
- Delivery management
- Optimize employee performance
- Enhance organizational efficiency
Key Factors in Project Profitability Analysis:
Factors | Description |
Financial Metrics | To measure project performance, evaluate indicators like NPV (net present value), IRR (internal rate of return), and profit margins. |
Cost Breakdown | Analyze all project expenses, including fixed, variable, direct, and indirect costs. |
Revenue Analysis | Review revenue streams, sales growth, and profit margins. |
Resource Utilization | Assess how efficiently resources are allocated and utilized. |
Risk Assessment | Identify and evaluate financial, operational, and strategic risks affecting profitability. |
Time Management | Monitor project timelines and their impact on financial performance. |
Comparative Analysis | Compare actual outcomes with initial forecasts to identify variances. |
Scenario Analysis | Simulate different scenarios to understand potential impacts on profitability. |
Decision Impact Review | Review decisions made during the project and their financial effects. |
Continuous Improvement | Identify process optimization and cost reduction areas to enhance future profitability. |
How To Measure Project Profitability?
There are two primary methods to measure any project’s profitability: leveraging project management software (to automate the process of calculating profit & loss) or using traditional financial formulas.
Method #1 – Using Project Management Software To Calculate and Measure Your Project Profitability | Avaza
Avaza, a project management software, simplifies the process of calculating and measuring project profitability.
With its advanced tools, Avaza provides a comprehensive view of your project’s financial performance, enabling you to stay on top of your finances and make informed decisions.
Here’s a detailed guide on how you can use Avaza’s features to calculate your project’s profitability 👇
1. Project Setup
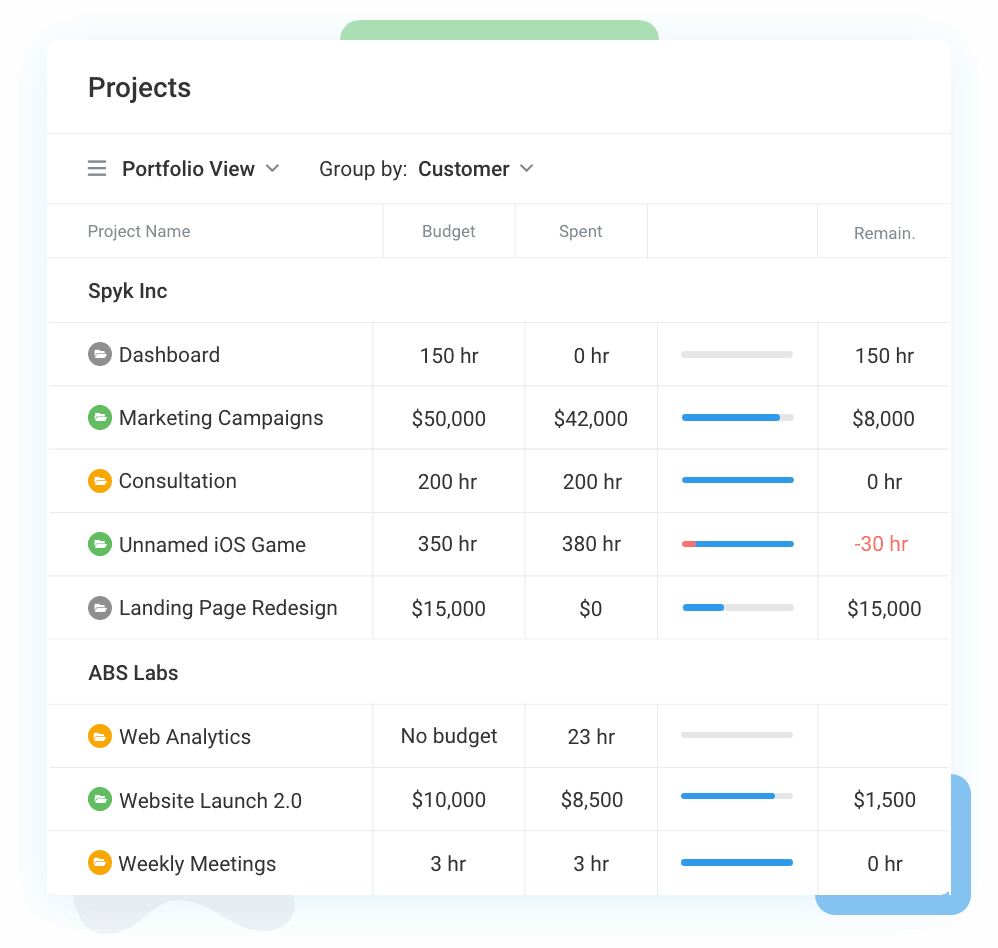
Initiate your project management workflow by meticulously configuring projects in Avaza. This includes comprehensive project scoping and stringent budgetary parameters to align with financial objectives.
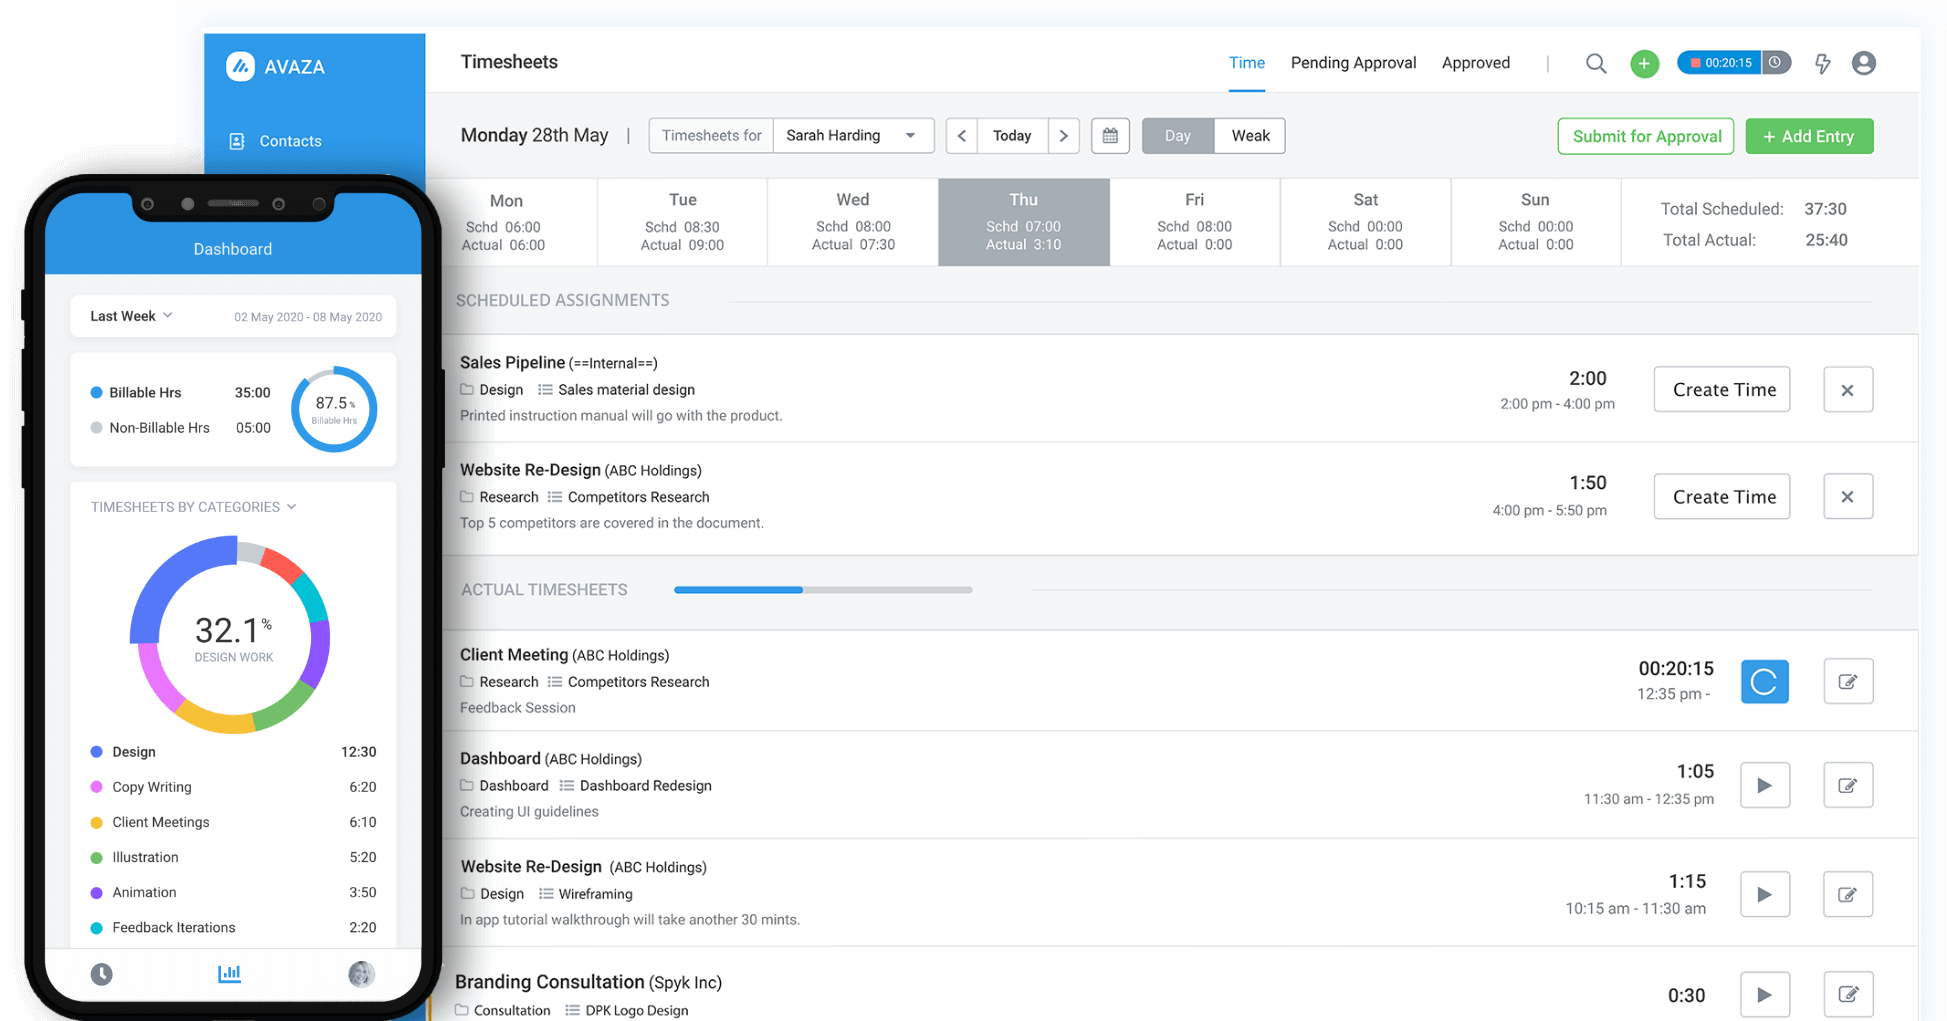
2. Time and Expense Tracking

Implement Avaza’s time-tracking, expense-monitoring, and bills functionalities to capture all billable hours and associated expenditures with precision.
Integrate a systematic review and approval workflow for timesheets to validate the accuracy and compliance of recorded hours against project specifications.
3. Cost Allocation and Analysis
Accurately allocate all direct and indirect project-related costs, including labor charges, materials procurement, and miscellaneous expenses.
Define and assign specific billing and cost rates for team members to ensure granular cost computation and facilitate precise labor cost analysis.
4. Automated Invoice Management
Leverage Avaza’s invoicing capabilities to generate and issue invoices with impeccable accuracy, reflecting completed deliverables and predefined rates.
For ongoing contracts, utilize the recurring invoice feature to automate billing cycles, thereby streamlining revenue tracking and ensuring fiscal consistency.
5. Profitability Reporting and Analysis

Exploit Avaza’s advanced reporting tools to synthesize profitability reports that compare revenue streams against incurred costs.
Customize these reports to dissect key financial metrics such as profit margins, cost variances, and revenue segmentation, providing actionable insights into financial performance.
6. Resource Optimization and Scheduling
Employ Avaza’s resource management features to monitor and optimize the scheduling of resources across various tasks and projects.
Strategically plan and schedule resources based on availability and project demands to mitigate the risks of overutilization or underutilization, ensuring operational efficiency.
7. Client and Project Profitability Insights
Generate detailed profitability assessments for individual clients or projects using Avaza’s analytical features.
Evaluate project outcomes regarding cost-efficiency, time management, and revenue generation to identify high-value clients and optimize project strategies.
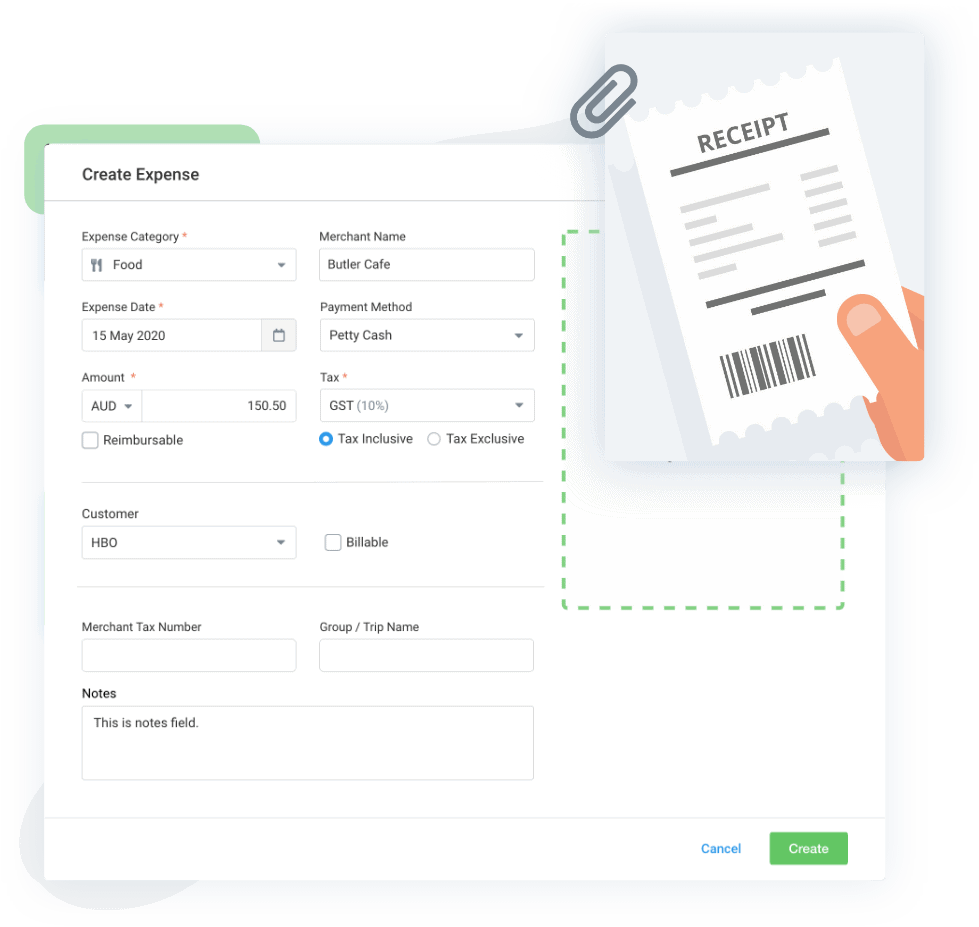
8. Expense Oversight and Control

Maintain stringent oversight of project-specific expenses by utilizing Avaza’s expense management features.
Generate comprehensive expense reports to ensure accurate financial accounting and effective control over project spending, minimizing the risk of budget overruns.
9. Integrations
Accounting Software Integration: Achieve seamless synchronization of financial data, including invoices, expenses, and payments, by integrating Avaza with leading accounting platforms such as Xero and QuickBooks.
Payment Gateways Integration: Use payment gateways like PayPal and Stripe to process payments directly from invoices and track them within Avaza.
Why Avaza?
Avaza excels in the market due to its high ratings and positive user feedback. Avaza has 4.6 out of 5 stars on Capterra as of the writing date.
Here are some testimonials and success stories from Avaza customers.


Try Avaza For Free
If you feel that Avaza might be the software to measure the profitability for your projects, sign up to start using Avaza for free. If you need any help with your Avaza subscription or want to better understand our pricing, please contact chat support or email support@avaza.com.
Method #2 – Using Project Profitability Formulas
Below are eleven pivotal formulas that provide comprehensive insights into the profitability of a project.
1. Net Profit Margin
The Net Profit Margin is a crucial metric that shows the percentage of revenue remaining as profit after deducting all expenses, including operating costs, taxes, and interest.
This ratio offers a clear snapshot of how effectively a project is converting revenue into actual profit.
🔍 Formula
Net Profit Margin = Net Profit ⁄ Total Revenue x 100
A higher net profit margin indicates a more profitable project, signifying superior cost management and pricing strategies.
2. Gross Profit Margin
The Gross Profit Margin focuses exclusively on the profitability of core operations by considering only the direct costs associated with production or service delivery. This metric highlights the efficiency with which a project manages its direct costs, such as materials and labor.
🔍 Formula
Gross Profit Margin = Gross Profit ⁄ Total Revenue x 100
By isolating these costs, you can better understand how effectively the project is generating profit from its primary activities.
3. Return on Investment (ROI)
The ROI percentage denotes the return on each dollar invested in the project. It’s typically shown as a percentage and helps assess investments, compare them with alternatives, or gauge potential opportunities.
🔍 Formula
ROI = Net Profit ⁄ Initial Investment x 100
A higher ROI signifies a more effective use of resources, leading to greater returns on the initial investment.
4. Cost-Benefit Analysis (CBA)
This analysis involves a detailed comparison of a project’s expected costs against its anticipated benefits. It helps determine whether a project is financially viable by illustrating the overall value it will bring to the organization.
🔍 Formula
Cost-Benefit Analysis (CBA) doesn’t have a single, standard formula like some other financial metrics because it involves qualitative and quantitative assessment of costs and benefits.
However, you can summarize the analysis with the following formula for simplicity:
Net Benefit = Total Benefits − Total Costs
In this context:
- Total Benefits includes all anticipated benefits from the project, such as increased revenue, cost savings, or other financial gains.
- Total Costs encompass all costs associated with the project, including direct costs, indirect costs, and any other expenditures.
The project is considered financially viable and worth pursuing if the Net Benefit is positive. If it’s negative, the costs outweigh the benefits.
Key Considerations:
- Estimate all relevant costs, including direct and indirect expenses.
- Project the benefits, which may include increased revenue, cost savings, or other financial gains.
- Compare the two to determine if the benefits justify the costs.
Cost-benefit analysis provides a solid foundation for making informed investment decisions.
5. Break-Even Analysis
Break-even analysis identifies the point at which total revenue equals total costs, meaning the project has neither made a profit nor incurred a loss. This metric is crucial for determining the minimum sales volume required to cover all costs, thereby setting performance benchmarks.
🔍 Formula
Break-Even Quantity = Fixed Costs ⁄ (Sales Price per Unit – Variable Cost Per Unit)
Understanding the break-even point helps in setting realistic sales targets and pricing strategies.
6. Payback Period
The Payback Period measures the time required to recoup the initial investment through the project’s generated cash flows.
This metric is particularly useful for assessing the risk associated with a project; a shorter payback period often indicates lower financial risk and quicker recovery of invested capital.
🔍 Formula
Payback Period = Initial Investment ⁄ Net Cash Flow per period
Investors and project managers prefer projects with shorter payback periods, as they offer faster returns and reduce exposure to long-term uncertainties.
7. Net Present Value (NPV)
NPV calculates the difference between the present value of cash inflows and outflows over a specified period, accounting for the time value of money. This metric provides a comprehensive view of a project’s profitability by considering the value of future cash flows in today’s terms.
🔍 Formula
NPV = [cash flow ⁄ (1+i)^t] – initial investment
Where:
- i is the discount rate
- t is the time period
A positive NPV indicates that the project is expected to generate more value than it costs, signaling profitability and justifying the investment.
8. Contribution Margin Analysis
The Contribution Margin represents the difference between the unit selling price and the variable cost per unit. This metric is crucial for understanding how much each unit sold contributes to covering fixed costs and generating profit.
🔍 Formula
Contribution Margin Analysis = Revenue – Variable Costs
Analyzing the contribution margin helps in assessing the impact of changes in sales volume on overall profitability and making informed decisions about pricing and cost management.
9. Profitability Index (PI)
The Profitability Index, also known as the benefit-cost ratio, measures the relative profitability of a project. It is calculated by dividing the present value of future cash flows by the initial investment.
🔍 Formula
PI = Present Value (PV) of Future Cash Flows ⁄ Initial Investment
A PI greater than 1 indicates that the project is likely to be profitable, as the value of future cash flows exceeds the initial investment.
10. Scenario Analysis
Scenario Analysis involves evaluating the impact of different potential scenarios—such as changes in costs, prices, or demand—on a project’s profitability. This approach helps identify potential risks and opportunities, providing a clearer picture of the range of possible outcomes.
🔍 Formula
For Scenario Analysis, there isn’t a single formula since it involves evaluating multiple possible scenarios and their impacts on project profitability.
However, you can summarize the process using the following steps and formula:
- Define Scenarios: Identify different possible scenarios that could affect the project, such as changes in costs, prices, or demand.
- Estimate Financial Impact: For each scenario, estimate the financial outcomes, including changes in revenue, costs, and profits.
- Calculate Projected Profitability for Each Scenario:
Projected Profit = Projected Revenue − Projected Costs
- Compare Results: Analyze the profitability across different scenarios to assess potential risks and opportunities.
- Determine Best and Worst Case Outcomes:
- Best Case: Scenario with the highest projected profitability.
- Worst Case: Scenario with the lowest projected profitability.
While there’s no single formula for Scenario Analysis, these steps provide a structured approach to understanding how various factors might impact the project’s success.
11. Comparative Analysis
Comparative Analysis allows you to benchmark a project’s financial performance against similar projects or industry standards. This approach provides context to your project’s results, helping you understand how it measures up to competitors or industry norms.
Applications:
- Compare key financial metrics with those of similar projects or companies.
- Analyze performance against initial projections to assess accuracy.
- Use industry benchmarks to gauge overall project success.
Accurate comparisons require selecting projects or companies with similar characteristics, ensuring meaningful insights into the project’s relative performance.
🔍 Formula
For Comparative Analysis, there isn’t a single formula per se, but you can use a set of ratios and metrics to compare the financial performance of different projects or companies.
Here are some commonly used formulas for comparison purposes:
- Comparison of Profit Margins: To compare the profitability of similar projects or companies.
Comparison Ratio = Profit Margin of Project A / Profit Margin of Project B
- Comparison of Return on Assets (ROA): To evaluate how efficiently assets are used in generating profits.
ROA = Net Income / Total Assets
- Comparison of Return on Equity (ROE): To assess how effectively equity is being used to generate profits.
ROE = Net Income / Shareholder’s Equity
- Comparison of Debt-to-Equity Ratio: To compare the financial leverage of different entities.
Debt-to-Equity Ratio = Total Debt / Shareholder’s Equity
- Comparison of Earnings Before Interest and Taxes (EBIT): To assess the operational performance without the influence of financing and tax.
EBIT Comparison = EBIT of Project A / EBIT of Project B
- Comparison of Price-to-Earnings (P/E) Ratio: To evaluate how the market values a company’s earnings.
P/E Ratio = Market Price per Share / Earnings per Share
By applying these formulas, you can compare different projects or companies on a range of financial metrics, providing a clearer picture of their relative performance and financial health.
How Can I Improve Project Profitability?
Subheading | Content |
Plan It Out | Define clear objectives, deliverables, and timelines. Break the project into tasks and use project management tools like Avaza to track progress. |
Improve Project Scope Management | Clearly define and agree on the project scope. Review it regularly to prevent scope creep and manage changes through formal processes. |
Optimize Resource Allocation | Allocate resources based on project needs. Monitor and adjust to avoid overallocation or underutilization. Use project resource scheduling tools to track and optimize resource use. |
Create Realistic Cost Estimates | Develop cost estimates by analyzing all components and using historical data. Compare estimates with actual costs to adjust budgets and control expenses. |
Maintain Open Communication | Ensure regular updates and transparency among team members and stakeholders. Use communication tools and meetings to address issues and keep the project aligned. |
Plan for the Unexpected (Risk Management) | Identify potential risks and develop contingency plans. Regularly update risk strategies and monitor effectiveness to minimize disruptions. |
Using Work Management Tool | Use work management tools to track tasks, deadlines, and team collaboration. Features like Gantt charts and progress tracking enhance project organization. |
Efficient Team Management | Efficient team management facilitates project profitability through clear roles, progress tracking, and leveraging strengths. Invest in training, promote well-being, and support a collaborative environment. |
Rate Realization Vs. Project Profitability Analysis
Rate realization and project profitability analysis are distinct yet related models used to assess an organization’s financial condition. Here are the key differences between the two.
Aspect | Rate Realization Analysis | Project Profitability Analysis |
Definition | Measures the difference between the potential earnings of a project and the actual earnings achieved. | Evaluates the profit of a project by comparing the revenue generated to the costs incurred. |
Focus | Concentrates on how well a project’s resources were utilized to achieve its earning potential. | Assesses whether a project is profitable by looking at direct costs versus generated revenue. |
Process | Involves using software tools to analyze resource utilization and identify gaps in achieving potential earnings. | Involves comparing project revenue to direct costs, such as labor and materials, to determine profitability. |
Goal | Aims to identify and rectify issues that prevent achieving the full earning potential, thereby improving future project profitability. | Aims to understand cost structures and manage expenses to enhance overall project profitability. |
Scope | Focuses specifically on individual project earnings and how well resources are used. | Provides a broader view of project profitability by incorporating overall cost and revenue data. |
Limitation | Does not account for the total cost structure of the project, potentially overlooking broader financial impacts. | May not provide detailed insights into resource utilization or specific barriers to higher earnings. |
After reviewing the comparison, the question arises: which one should you use?
They both focus on different aspects of project performance.
Choose Rate Realization Analysis if your goal is to enhance profitability. This method helps pinpoint ways to optimize earning potential and identifies barriers hindering greater profits.
If you aim to reduce costs, opt for project profitability analysis. This approach examines both direct and indirect expenses to help manage and lower the overall costs impacting project profitability.
What Is Considered A Good Profit Margin?
A good profit margin depends on the industry. Typically:
- 5% is considered low, indicating tight margins and high competition.
- 10% is viewed as healthy and sustainable for many businesses.
- 20% or higher is seen as excellent, often achieved by firms with high-value products or services and lower costs.
Margins vary by sector, so compare your business to industry averages for accurate assessment.
Frequently Asked Questions (FAQs)
1. What are the key factors that contribute to project profitability?
Various factors impact project profitability. Key elements include:
- Precise cost estimation
- Strong project management
- Smart resource allocation
- Well-considered pricing strategy
- Prompt billing and collection
- Thorough risk management
2. How can you make your projects more profitable without spending extra money?
Focus on resource optimization to enhance project profitability without incurring additional expenditures. Delineate the project scope to mitigate beyond the agreed-upon scope. Refine project planning processes to prevent budget overruns.
Implement robust time-tracking mechanisms to maximize billable hours and ensure efficient resource allocation. Continuously analyze and address operational inefficiencies to drive ongoing improvements.
Conclusion
Measuring project profitability is essential for assessing financial returns and optimizing performance. Focusing on KPIs provides a clear picture of financial health. Track net profit, ROI, and profit margins, and evaluate cost and revenue. Monitor resource allocation and conduct risk analysis.
Systematic comparisons and scenario analyses further refine this understanding, identifying gaps and uncovering opportunities for strategic improvement.
Avaza provides solid tools for time tracking, cost management, and profitability reporting, enabling you to make informed decisions and drive your projects toward greater financial success. It streamlines your profitability measurement and enhances project outcomes.
