Resource Utilization: How to Measure & Improve Team Performance
Teams say they’re “at capacity,” but most are guessing.
Resource utilization turns guesswork into signal “who’s on the right work, who’s overloaded, and where margin leaks”.
Done right, it’s not about squeezing hours; it’s about protecting focus, planning with intent, and hitting targets without burnout.
👉 This guide cuts to what matters? I.e., one simple formula, sane benchmarks, and a playbook you can run in weeks, not quarters.
You’ll plan by roles (then people), track the gap between schedule and reality, and use those deltas to steer the next week.
Fewer surprises.
Cleaner forecasts.
More building, less context-switching.
If you’ve ever bounced between idle bench time and a calendar that looks like Tetris on hard mode, this is for you. Let’s turn utilization into a lever for predictability and margin not a spreadsheet you dread.
What Is Resource Utilization In Project Management?
Resource utilization is the proportion of a resource’s available time that’s actually applied to planned work often emphasizing billable client delivery in agencies and consultancies. Treat it as a leading indicator of capacity health and a lagging indicator of profitability.
Dual lenses (used together).
Scheduled utilization (forward-looking): what your plan assigns.
Actual utilization (backward-looking): what timesheets confirm you truly spent.
Billable vs. non-billable. In many service firms, healthy utilization blends billable delivery with a prudent allowance for non-billable essentials (training, R&D, pre-sales). The “right” mix preserves both short-term margin and long-term capability.
▶️ How to calculate the utilization rate.
Base formula:
Utilization (%) = (Used hours ÷ Available hours) × 100
In billable shops, replace “Used hours” with Billable hours.
💡 Example: A developer with 40 available hours logs 32 billable hours.
There’s no single magic number, but credible benchmarks cluster by scope and role:
Organization-wide (actual): ~70–85%. Leaves room for internal work, recovery, and unavoidable variance.
Delivery roles (designers, developers, consultants): plan ~75–90% scheduled and expect ~80–85% actual when things are healthy.
Leads / Managers / Principals:~60–75% actual by design to preserve capacity for oversight, coaching, pre-sales, and strategic work.
Practical guidance
👉 Avoid chasing 100%. That’s a risk signal, not a goal; sustained overutilization drives burnout, quality defects, and attrition.
👉 Set targets by role and seniority. Calibrate scheduled vs. actual expectations (e.g., 85% scheduled → ~80% actual for delivery).
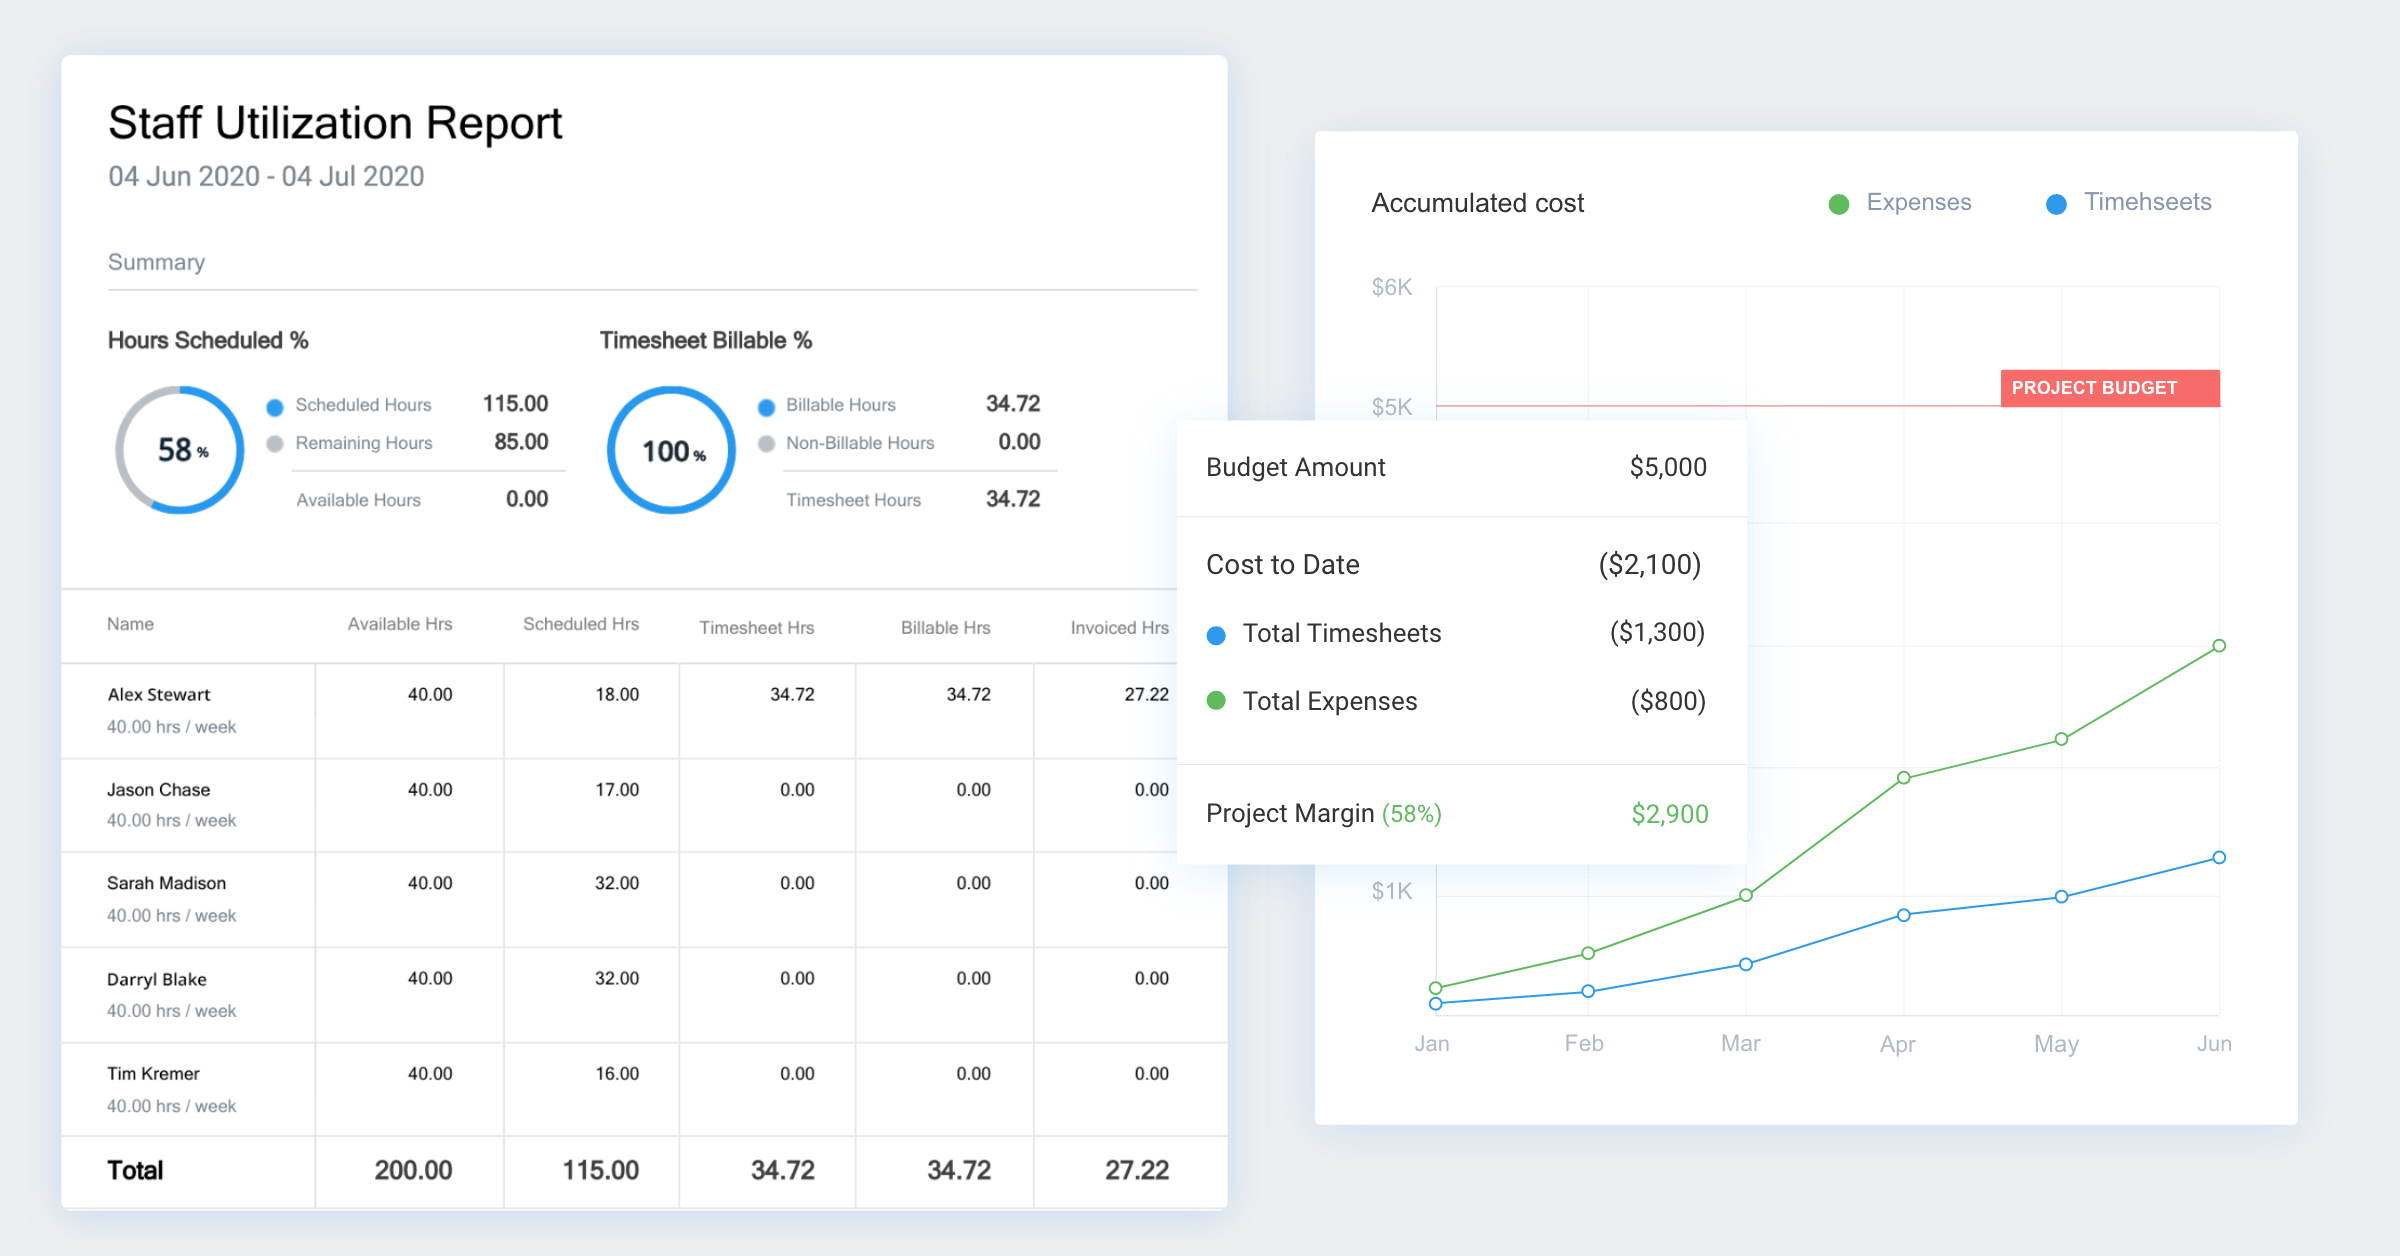
👉 Instrument and iterate. Use utilization dashboards (e.g., Avaza) to visualize targets by role, track actuals, and dynamically rebalance allocations without pushing teams past sustainable limits.
How to Build a Resource Utilization Plan (That Actually Works)
A resource utilization plan isn’t just a scheduling exercise “it’s your operating system for balancing people, projects, and profitability”.
Done right, it ensures that your team’s time is aligned with business goals, that workloads stay sustainable, and that billing reflects reality—not guesswork.
Here’s how to build a utilization plan that’s structured, measurable, and easy to maintain with Avaza.
Step 1 — Normalize Availability
Your utilization accuracy is only as good as your availability data. Start by cleaning the baseline.
Account for time off: Block public holidays, PTO, and training days in advance.
Adjust for part-time contracts or flexible arrangements. Don’t assume everyone has 40-hour weeks.
Define “available hours.” This should be true working time—excluding meetings, admin, and planned downtime.
📊 Why it matters: If availability is inflated, your utilization rate will look great on paper but crash in delivery.
With Avaza, you can automatically factor in time-off calendars and part-time schedules, ensuring your capacity numbers reflect reality before planning even begins.
Step 2 — Create Role-Based Demand
Once you know how much time is truly available, translate upcoming project demand into hours by role instead of by person.
For example: Project X might require 120h Front-End Dev, 60h QA, and 20h Project Management.
This approach focuses on skills instead of names, giving flexibility if team members shift or if contractors step in.
Tie role demand directly to project phases—design, development, QA, deployment—to forecast workload accurately.
💡 Pro tip: In Avaza, you can visualize role-level capacity versus demand instantly. This helps identify which departments will be over- or under-loaded weeks in advance.
Step 3 — Assign Using Constraints
Here’s where real-world operations meet planning discipline.
Assign people based on real capacity. Use drag-and-drop scheduling to match demand with the right skillset.
Honor guardrails: Cap hours per day, watch for overlapping projects, and avoid assigning the same person to multiple deliverables simultaneously.
Balance workloads visually. Use color-coded workload views to see who’s near burnout and who’s underused.
💻 Why Avaza wins: Avaza’s Resource Scheduling module provides both team and project views. Managers can drag, drop, and rebalance allocations in real time while workload heatmaps highlight red zones before they turn into delivery risks.
Step 4 — Lock Time Tracking Discipline
Your utilization data is only as good as your actuals. That’s where time tracking becomes your secret weapon.
Make time entry simple and non-intrusive. Avoid end-of-week backfilling—it skews your data and kills accuracy.
Automate reminders so team members log time daily.
Distinguish between billable and non-billable hours. This enables margin tracking and performance analysis by client, role, and project.
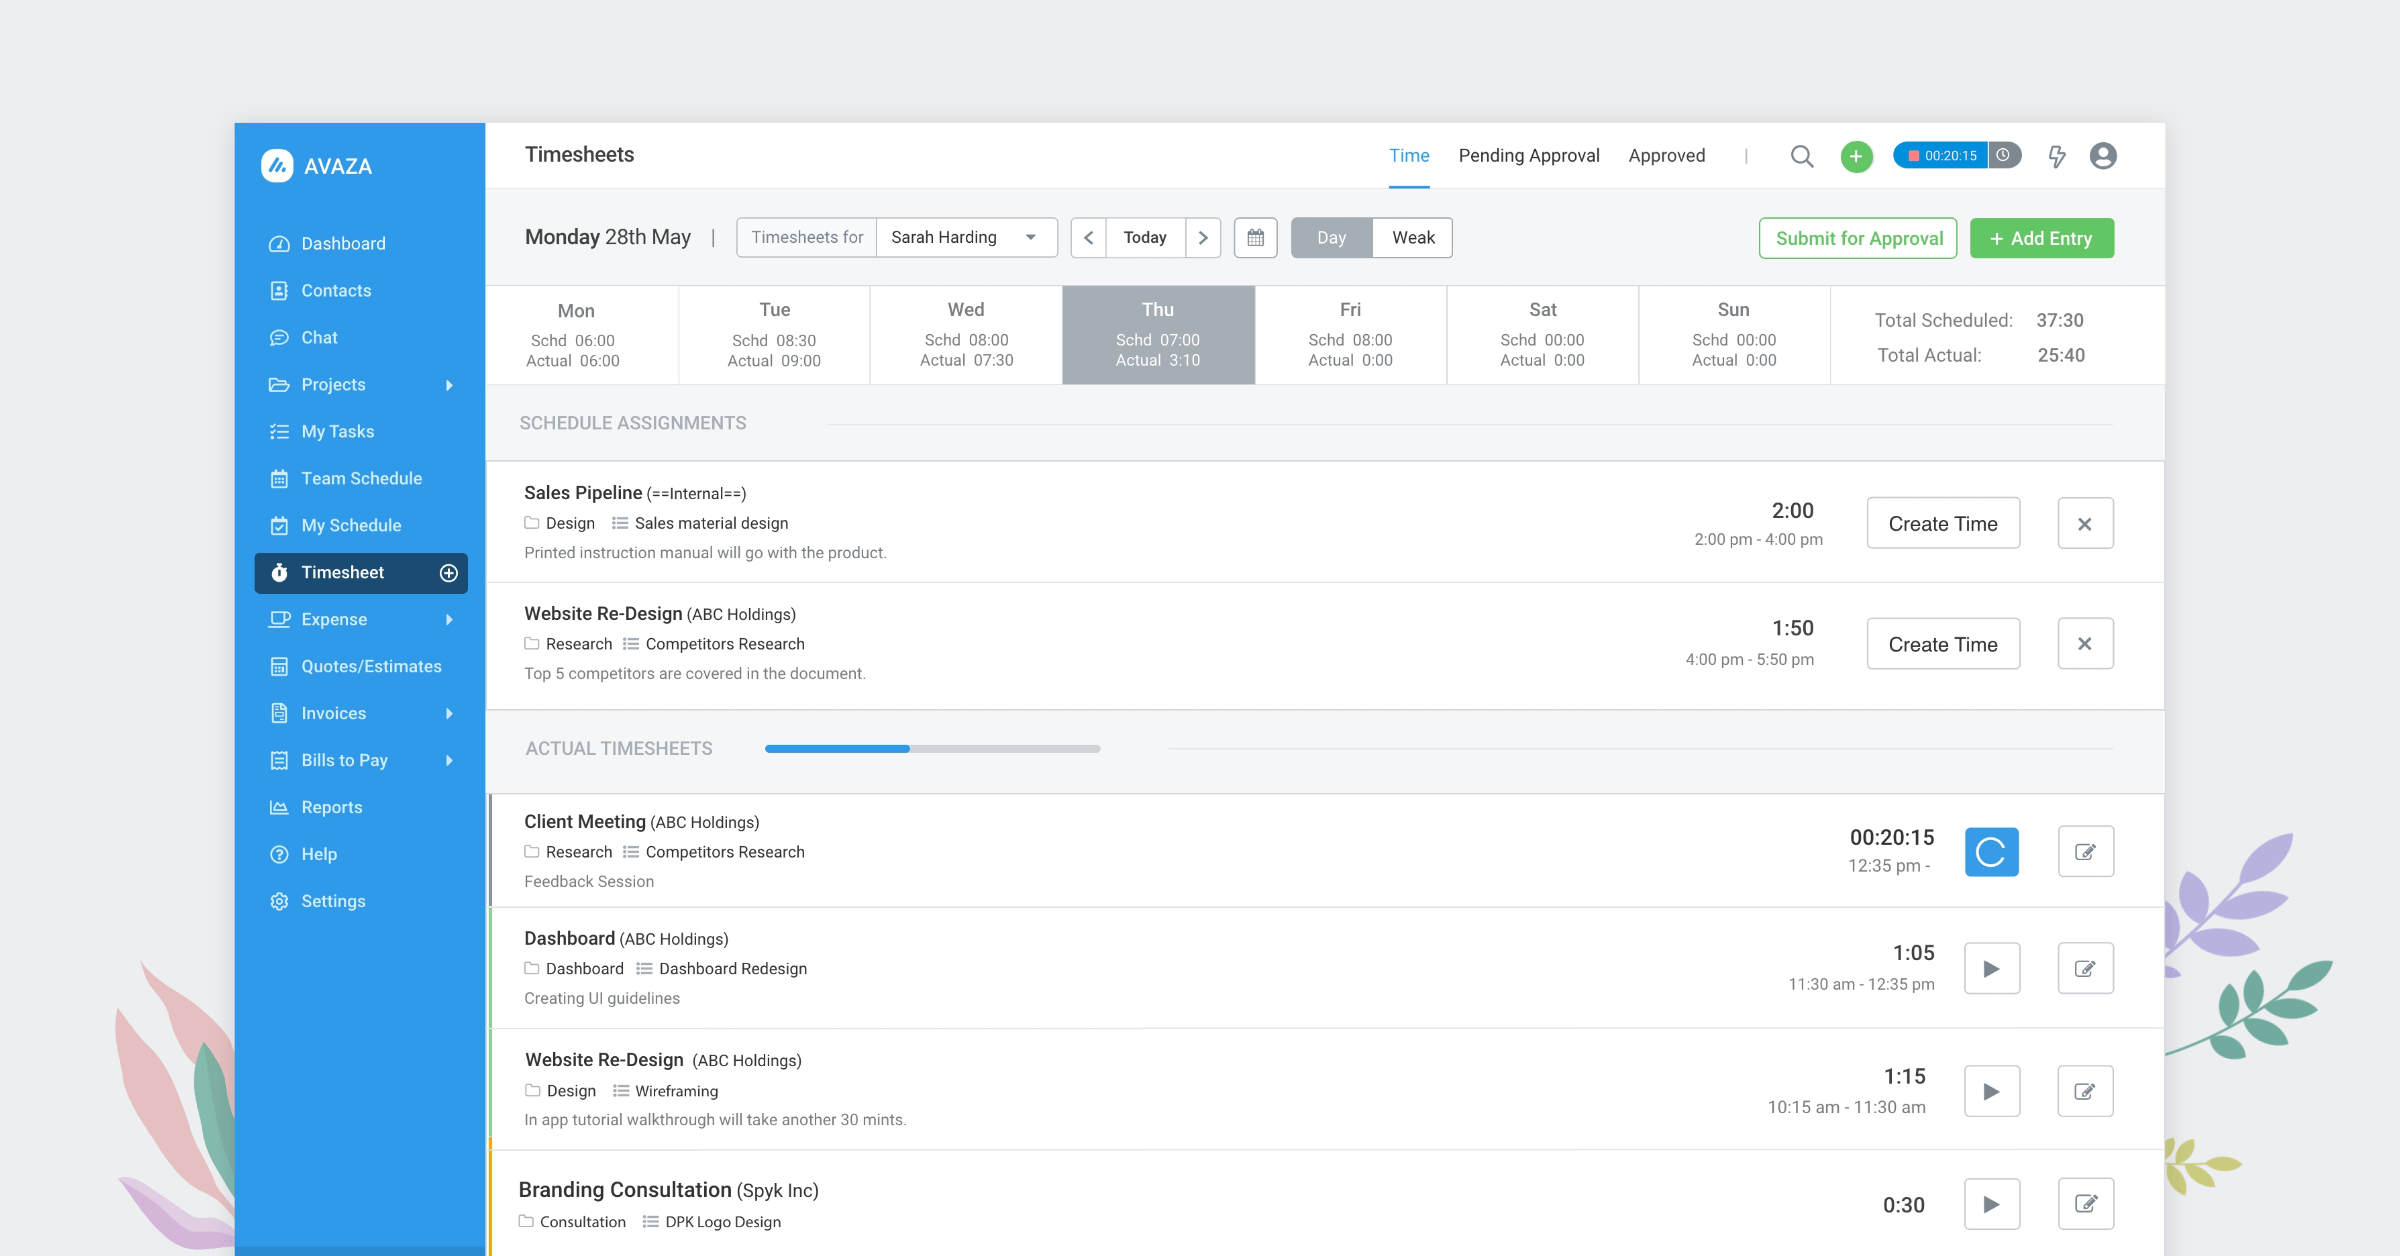
📈 In Avaza, time tracking flows seamlessly from assigned tasks and scheduled hours. Timesheets are intuitive, and data auto-syncs with utilization and invoicing reports (no manual reconciliation needed).
Step 5 — Review & Re-plan Weekly
Utilization planning is never “set and forget.” Make review a ritual.
Compare scheduled vs. actual utilization weekly. This shows whether teams worked as planned or if hours drifted elsewhere.
Identify variances early. If planned 80% turns into actual 110%, investigation causes “scope creep, urgent bugs, or misestimated work”.
Rebalance proactively. Shift allocations, add support resources, or reforecast delivery timelines before issues escalate.
🔁 With Avaza, you can generate side-by-side reports comparing scheduled vs. actual utilization. This gives delivery leaders instant visibility into trends and lets them correct course within the same dashboard.
✅ Avaza Tip: Avaza’s Resource Scheduling combines drag-and-drop assignments, workload heatmaps, and integrated calendars. Managers can instantly reassign, reschedule, and communicate updates, keeping utilization optimized and burnout at bay.
Utilization vs. Capacity vs. Availability — Keep The Terms Clean (And Actionable)
In professional services, these three terms get tossed around interchangeably and that’s where planning breaks. Treat them as distinct levers you can actually manage.
▶️ Availability
Availability is the workable time a person has in a given period after you subtract non-working days and constraints. Think: public holidays, PTO, part-time contracts, training days, and statutory leaves.
Why it matters: It’s your baseline denominator for every utilization calculation. If availability is wrong, every downstream metric (utilization, margin per FTE, forecast accuracy) is off.
Operator cue: Maintain a single source of truth for calendars; don’t rely on ad hoc spreadsheets.
▶️ Capacity
Capacity is availability aligned to the skills and demand profile of your portfolio. It’s not just “hours” it’s hours of the right people with the right skills at the right time.
Why it matters: Hiring decisions, contractor requests, and sprint commitments depend on capacity, not abstract availability.
Operator cue: View capacity by role (e.g., FE Dev, QA, UX, PM) and by skill tags (React, Accessibility, Security Review) to avoid bottlenecks masquerading as “we have hours.”
▶️ Utilization Utilization is the planned or actual consumption of capacity on real tasks. It comes in two flavors:
Scheduled utilization (forward-looking): What your plan allocates for the next 2–8 weeks.
Actual utilization (backward-looking): What timesheets confirm really happened.
Why it matters: Utilization is the leading indicator for delivery health and a lagging indicator for profitability. High variance between scheduled and actual is your smoke alarm for scope creep, context switching, and shadow work.
👉 Practical takeaway for operators
Plan at the role level first; map named people second. Roles absorb volatility and holidays; names alone create fragility.
Start with role-based demand (e.g., “120h FE Dev, 60h QA”), then allocate named resources against that plan.
Keep allocation windows short (2–4 weeks) so your plan can breathe with reality.
Why Avaza wins here
Resource Scheduling gives you Team and Project views with workload heatmaps, making availability, capacity and utilization distinct and visible.
Skill tags and role-based filtering help you see capacity fit, not just raw hours.
Time Tracking closes the loop, scheduled vs. actual utilization is surfaced without spreadsheet gymnastics.
The Utilization Metrics That Actually Matter (And What They Really Tell You)
You don’t need thirty KPIs cluttering your dashboards, you need a handful of metrics that guide real operational decisions week after week.
These utilization metrics help you balance profitability, workload, and sustainability and in Avaza, each one is built right into your reporting flow.
1. Billable Utilization (%) — The Revenue Health Check
What it shows: Are your teams converting time into revenue as expected? This is the pulse of your financial efficiency.
Operator insights:
If too low: Review sales pipeline timing, client delays, or unassigned bench hours. Productize recurring internal work into billable packages.
If too high: Watch for red flags—unsustainable overtime, dropping quality, or hidden write-offs waiting to surface.
📈 Avaza tip: Track billable utilization by person, role, or client in real time. Instant visibility into revenue alignment without manual reporting.
2. Total Utilization (%) — The Sustainability View
Total Utilization (%) = (Billable + Planned Non-Billable) ÷ Available Hours × 100
What it shows: How effectively are you using your team’s total available time, across both client work and strategic investments (like R&D, pre-sales, or enablement)?
Operator insights:
Protect non-billable time that builds long-term value—don’t “steal from the future” to hit short-term targets.
Smooth peaks and troughs by shifting non-billable activities into quieter weeks.
🧭 In Avaza: Total utilization dashboards let you view delivery balance by department or team—keeping sustainability in focus alongside profit.
3. Scheduled vs. Actual Utilization (Δ) — Forecast Accuracy & Scope-Creep Radar
The variance (Δ) between planned utilization and actual hours logged.
What it shows: How accurate is your planning? Variance reveals hidden issues: scope creep, unplanned work, or inefficient task switching.
Operator insights:
If Δ > 10 points for two or more weeks, it’s time to re-evaluate—adjust allocations, refine estimates, or rebalance staffing.
Persistent deltas usually signal that shadow work is eroding project profitability.
🔍 Avaza insight: Weekly “Scheduled vs. Actual” variance reports flag these gaps automatically, so you can correct mid-project, not post-mortem.
4. Billable vs. Non-Billable Mix — The Portfolio Health View
The percentage split of time between billable and non-billable activities across teams, roles, or clients.
What it shows: Whether your internal work (training, pre-sales, internal R&D) is strategic, or accidental. A healthy mix supports growth; a skewed mix drains focus and profitability.
Operator insights:
Plan non-billable time intentionally—add structure to enablement or pre-sales.
Prevent ad hoc admin work (“Slack pings”) from eating productive capacity.
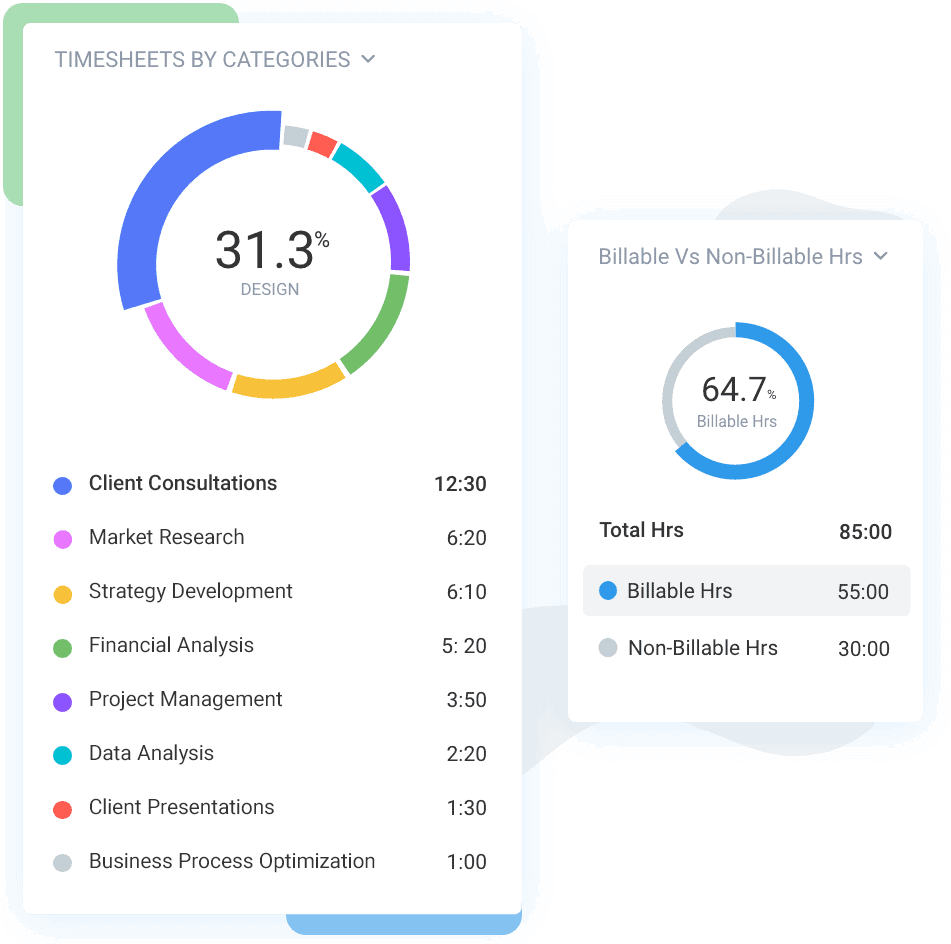
📘 Avaza view: Segment billable vs. non-billable hours by client, role, or project to instantly identify where your team’s time is best spent.
5. Role-Based Utilization — The Early Warning for Bottlenecks
Utilization measured by role or discipline (e.g., QA, UX, Backend, Security).
What it shows: Which roles are nearing capacity and where demand will soon outstrip supply—weeks before it hits delivery timelines.
Operator insights:
If QA or Dev roles exceed safe thresholds, pull forward contractor hours or redistribute tasks.
Re-sequence work to prevent high-impact bottlenecks from delaying delivery.
💡 Avaza advantage: Filter workload and utilization by role, department, or skill tag. Identify at-risk functions early and rebalance in seconds.
6. Overtime Utilization — The Sustainability Reality Check
The share of work performed beyond normal hours.
What it shows: If your plan only works because people are working late, the plan doesn’t work. Overtime masks structural issues like poor estimation or underscoping.
Operator insights:
Recalibrate effort estimates and rebalance teams to remove dependency on overtime.
Communicate with clients—buffered timelines protect quality and morale.
💡 Avaza tip: Monitor actual hours against scheduled capacity to spot unsustainable patterns early. Prevention is cheaper than burnout.
Bringing It Together
Each of these six metrics connects planning, delivery, and performance in one continuous loop.
With Avaza, that loop is seamless:
Plan workloads visually.
Track time with accuracy.
See utilization, margin, and profitability in real time.
No spreadsheet cleanups. No lag between work done and insights gained. Just clear, connected data to help you run a more profitable and more sustainable team.
What Causes Low (Or Dangerously High) Utilization?
Resource utilization problems usually aren’t caused by people being lazy or overworked as they’re caused by invisible mismatches between planning, pipeline, and prioritization.
Let’s break down both ends of the spectrum.
🚨 Under-Utilization (Low %)
Under-utilization might sound like a “nice problem to have,” but it’s a silent margin killer. When people are underused, revenue leaks and morale drops.
Common causes:
Over-segmented skills: Specialists with narrow scopes can’t be redeployed easily across projects.
Uneven project demand: Over-reliance on a few clients creates lumpy workloads—busy one month, idle the next.
Weak intake and prioritization: Too many “maybe later” projects clog the pipeline, while approved ones sit waiting for kickoff.
Poor visibility: Teams can’t see open capacity because information lives in spreadsheets and siloed tools.
The impact: Under-utilization erodes profitability, reduces billable output, and leads to disengagement, your best people start looking elsewhere.
🧩 How Avaza helps: Avaza’s real-time Capacity vs. Demand view shows who’s underbooked by role or skill. You can pull them into in-flight projects instantly or forecast where to fill upcoming gaps.
⚠️ Over-Utilization (Too High %)
At the other extreme, over-utilization feels productive—until it isn’t. Teams working at 100%+ capacity might hit short-term targets, but they’re heading straight for burnout and rework.
Typical causes:
Habitual overbooking: Planning for 40 billable hours when reality allows 32.
Optimistic estimates: Managers underestimate the effort required, assuming “it’ll fit somehow.”
Hidden work: Context switching, client emails, rework, and internal meetings that aren’t tracked in the plan.
Chronic overtime: Sustained 90–100%+ utilization destroys quality, creativity, and retention.
The impact: Deadlines slip, error rates rise, and senior staff burn out—leading to turnover and hidden recruitment costs. Over time, what looks like efficiency becomes operational debt.
🔥 Avaza to the rescue: Avaza’s Workload Heatmaps visualize real-time utilization by person or role, color-coded to show who’s overbooked. Delivery leaders can reassign work weeks in advance instead of discovering red zones on Friday night.
What Strategies Actually Improve Resource Utilization (Without Burning People Out)
For teams running multiple projects, resource utilization is where profitability and performance intersect. When done right, it aligns people, projects, and profit. When done wrong, it drains energy and erodes margins.
Below are seven proven strategies used by high-performing digital agencies, IT firms, and engineering consultancies, and how Avaza makes them effortless.
1. Forecast Demand 4–8 Weeks Ahead
Avoid reactive resourcing. Link your sales pipeline directly to capacity planning so future demand doesn’t surprise you.
Maintain an 8-week rolling forecast, updated weekly.
Include tentative deals and change requests in your projections.
Account for PTO, hiring lag, and training time in your capacity outlook.
📈 Avaza advantage: Avaza’s Capacity vs. Demand view visualizes future workload by role and skill, so you can predict shortfalls early and plan confidently.
2. Use Role Pools + Skill Tags
Stop assigning by name—assign by role and skill first. It builds resilience into your planning.
Group resources by functional roles (e.g., UX Designer, QA Engineer).
Tag specific skills (e.g., React, Kubernetes) for precision.
Replace unavailable team members without reworking the entire schedule.
💡 In Avaza: Filter utilization by role or tag, instantly revealing who’s free, who’s busy, and which skills you need to rebalance workloads fast.
3. Shorten Planning Horizons
Plans that stretch too far break fast. Keep two-week planning cycles to match the speed of change.
Reduces drift between plan and reality.
Fits perfectly with agile, sprint-based teams.
Enables frequent adjustments based on new actuals.
💻 With Avaza’s drag-and-drop scheduler, you can reassign, shift, or extend allocations within seconds—no messy spreadsheets, no chaos.
4. Enforce Realistic Utilization Caps
Chasing 100% utilization is a trap. Smart teams cap utilization at ~85% to leave breathing room for collaboration, reviews, and client syncs.
The remaining 15% is your safety valve—it absorbs untracked work.
Roles differ: delivery teams can sustain 80–85%; leads should stay around 70%.
Sustainable utilization reduces turnover and improves quality.
Avaza’s workload heatmaps visually flag when utilization exceeds safe limits—giving managers a chance to correct before burnout begins.
⏱️ 5. Automate Time Capture Nudges
Without accurate timesheets, utilization data is fiction. Automate compliance.
Gentle reminders encourage daily time entry.
Auto-fill planned tasks to simplify submissions.
Better data = better forecasting accuracy.
🧩 Avaza syncs time tracking directly to scheduled work, making compliance natural and effortless. Expect >95% accuracy without nagging.
6. Standardize Project Templates
If every project starts from scratch, utilization chaos follows.
Create standardized project templates to stabilize estimates and ensure consistent resource planning.
Templates capture typical hours per role and task.
Reuse them across similar project types.
Refine them with post-project learnings for continuous accuracy.
💼 Avaza lets you clone successful project structures, automatically inheriting task lists, roles, and estimated durations—so every new project starts 80% ready.
7. Protect Recharge & Learning Time
Healthy utilization isn’t about squeezing people; it’s about sustaining performance.
Schedule learning blocks, training, or “innovation hours.”
Track this non-billable time deliberately—not as waste, but as investment.
Teams that rest and learn outperform those that grind.
💡 Avaza’s reporting distinguishes billable vs. non-billable hours by person, role, and client helping leaders keep a healthy utilization mix.
Frequently asked questions
What’s the difference between resource utilization and billable utilization?
Resource utilization measures how much of a person’s available time is used productively, including both billable and non-billable work (training, pre-sales, internal projects). Billable utilization looks only at client-billable hours against available time. Track both: one protects capacity and wellbeing; the other protects margins and pricing accuracy.
What’s a good utilization rate?
Healthy ranges depend on role and seasonality, but a practical target is ~80–85% for delivery ICs, ~60–75% for leads or managers, and ~70–85% at the org level. If you’re consistently over 90%, you’re borrowing from tomorrow via burnout or quality risk.
What’s “scheduled vs. actual” and why does it matter?
Scheduled utilization is what you planned; actual utilization is what really happened. The difference (Δ) exposes estimating errors, scope creep, and hidden work. Review the delta weekly and adjust next week’s plan before a small missed snowball.
How do we raise utilization without burning people out?
Cap utilization (e.g., ~85% for ICs), add buffers for meetings and interrupts, and rebalance weekly based on schedule-vs-actual deltas. Protect recovery and learning time; they’re non-billable but essential for sustainable performance and quality.
How do capacity and availability differ?
Capacity is the theoretical max a role or person could deliver (e.g., 40 hours/week). Availability is capacity minus PTO, holidays, training, and standing meetings. Always calculate utilization against availability, not raw capacity.
Conclusion
Busy isn’t the goal “predictable, healthy delivery is”.
Resource utilization gives you the signal to get there: one simple formula, honest benchmarks, and a weekly loop that trades guesswork for evidence.
When you plan by roles first, cap workload, and review the gap between schedule and reality, your roadmap gets quieter, your forecasts get cleaner, and your team spends more time building than context-switching.
Don’t wait for a perfect system. Start small and make it routine:
Define available hours by role and set sane targets.
Build a four–six week role-first schedule (detail the next two).
Track time daily with clear categories.
Review schedule vs. actual every week, rebalance, repeat.