Project Dashboards: Real-Time Visibility for Smart Teams (Features, Tools, & Templates)
If you’ve ever managed multiple projects, clients, or cross-functional teams, you know the pain of chasing updates.
Tasks live in one tool, budgets in another, timelines in spreadsheets and by the time you’ve pieced everything together, the data’s already stale.
In today’s always-on delivery environment, project visibility isn’t a luxury, it’s survival.
Without it, even great teams slip into reactive mode like missed deadlines, surprise budget overruns, and those dreaded “how did we miss this?” moments.
That’s where project dashboards change the game. A well-built dashboard transforms scattered data into a single source of truth “showing what’s on track, what’s at risk, and how your team’s capacity is trending”.
But the real shift? Modern dashboards aren’t static reports anymore. They’re real-time control centers powered by automation, live data sync, and role-based insights thus giving leaders the power to manage proactively, not retrospectively.
💡 And that’s where Avaza stands out.
It’s more than just project dashboard software, it’s a connected ecosystem uniting projects, time, expenses, resources, and finances into one live, interactive workspace. Whether you’re a project Manager tracking milestones or an Ops Director forecasting utilization, Avaza helps you act before problems arise not after.
In this guide, we’ll cover:
- What makes a high-signal project dashboard
- How to build one step-by-step in Avaza
- The best tools reshaping visibility in 2025
- And why real-time dashboards have become every smart team’s competitive edge
By the end, you’ll know exactly how to move from managing chaos in spreadsheets to managing performance in real time.
What is a Project Dashboard?
A project dashboard is a live, visual workspace that pulls data from execution layers “tasks, milestones, timesheets, expenses, resource schedules, and invoicing” and renders status in real time. Static slides and spreadsheets go stale the second scope shifts. Dashboards stay current, surface exceptions, and shorten the distance from signal → decision.
🔑 In plain terms: A dashboard is your single pane of glass for delivery, cost, and capacity, so your leadership conversations move from opinion to evidence.
Top Project Dashboard Tools in 2025
As projects become more distributed and data-driven, the difference between “tracking progress” and “managing performance” often comes down to the tools you use.
Today’s project dashboard software isn’t just about visualization, it’s about real-time decision enablement.
Let’s take a closer look at the six leading tools shaping the project visibility landscape in 2025, and why Avaza continues to lead the pack for modern service teams.
Tool Name | Best For | Key Differentiator | Primary Trade-off | Pricing (indicative) |
Avaza | Agencies, consultancies, SaaS product teams managing delivery & finances | Unified PSA: projects + tasks + time + expenses + resources + billing | Requires discipline to set up full stack | |
Wrike | Large professional-services orgs with complex portfolios | Highly configurable dashboards, workload & Gantt reporting | Less built-in finance/billing functionality | |
ClickUp | Agile tech/product teams requiring flexible dashboards | Extensive custom fields/workflows & views | Financial/Utilization tracking often depends on integrations | |
Monday.com | Creative/delivery teams moving from spreadsheets | Highly visual UI + templated boards for client-facing work | Less depth for time/budget/invoicing out-of-box | |
Scoro | Consulting/enterprise service firms needing full stack | Projects + resources + finance + CRM all in one suite | Higher cost + steeper setup | |
Asana | Internal product/creative teams focused on workflow visibility | Clean interface + strong adoption rate | Limited native billing/time/expense features |
1. Avaza — The All-in-One PSA for Modern Teams
For digital agencies, consultancies, and SaaS product teams, Avaza is far more than a project dashboard, it’s a complete operational ecosystem.
Designed from the ground up as a Professional Services Automation (PSA) platform, Avaza unites the full delivery lifecycle “from task execution to invoicing, time tracking, resource management, and financial forecasting” into one seamless platform.
Best For: Teams managing multi-client delivery pipelines, where project health, utilization, and profitability must stay perfectly aligned.
🔹 Why Avaza Wins
Avaza stands apart because it connects operational and financial data natively, eliminating the data reconciliation, reporting delays, and “version chaos” that plague disconnected stacks.
Every number, metric, and milestone in Avaza comes from the same source of truth—live project execution.
Here’s what makes Avaza different:
- Unified platform: Projects, tasks, time tracking, expenses, scheduling, chat, and invoicing—all built-in, all connected.
- Real-time dashboards: Real-time dashboards with no data lag, no exports—just live insights across every project and portfolio.
- Automation-first workflows: Automation-first workflows with smart triggers that surface early warnings—like “budget burn > 80%” or “resource utilization > 95%.”
- Client-ready portals: Client-ready portals let you share real-time dashboards externally with granular access control and professional-grade visuals.
- Cross-functional clarity: Cross-functional clarity so PMs, Ops, Finance, and Executives all see the same live data—each through customized, role-based views.
- Lower TCO: By consolidating up to five separate tools, Avaza reduces both software spend and operational friction.
- Unified system of record: Unified system of record, where every timesheet, expense, milestone, and invoice lives within the same workflow—no data syncing required.
From Visibility to Action
Avaza doesn’t just show you what’s happening, it helps you act on it instantly.
Project managers can drill down from any dashboard widget to task-level details, time entries, or invoice line items, turning visibility into immediate, informed decision-making.
💡 Example: A Department Head reviewing utilization can instantly identify overbooked roles, assess associated costs, reassign workloads, and see the downstream budget impact, all within the same dashboard view.
With Avaza, reporting evolves into real-time management. Every dashboard becomes an interactive workspace that drives alignment, accountability, and profitability.
How do I Build a Project Dashboard Step-By-Step With Avaza?
Building a high-signal dashboard isn’t about piling on charts, it’s about operational clarity and by this we mean the fewest amount of widgets that can help drive the most decisions for PMs, Ops Directors, and Department Heads.
Below is a clean, repeatable flow with short context paragraphs followed by tight action bullets.
Avaza is the recommended path because execution data (tasks, time, expenses, scheduling) and commercial data (rates, invoices) live in one place, so your dashboard reflects reality, not yesterday’s export.
1) Define outcomes & audience (set the decision surface)

Before you drag a single widget, clarify what decisions this dashboard should enable and who will use it. Team, Executive, and Client views share the same truth—but require different granularity, time horizons, and tolerance for noise.
Decide: “What should someone do after 60 seconds on this page?”
Audience presets:
- Team Lead (daily/weekly): unblock work now (blockers, due items, owner load)
- Executive (weekly/monthly): govern portfolio predictability (on-time trend, utilization, margin signals)
- Client (weekly): confirm scope health and approvals needed (milestones, burn, decisions)
👉 Avaza move: Create three Saved Views up front—Team, Executive, Client—so you’re designing with intent, not retrofitting later.
2) Select the minimum viable metrics (6–10 signals max)
Great dashboards trade completeness for signal quality. Blend snapshot metrics (where we are) with flow metrics (how work moves) and financials (how we’re burning).
Pick from:
- Schedule health: % complete, milestone RAG, upcoming deadlines, critical path slack
- Flow & blockers: tasks due this week, blocker aging (>3/7 days), cycle/lead time
- Capacity & utilization: owner load, role capacity, conflicts
- Budget & time: actuals vs budget, billable vs non-billable, burn-rate, ETC
- Quality: on-time completion rate, reopen rate, change churn
- Owner clarity: DRI per deliverable; zero “Unassigned”
👉 Avaza move: Start with Milestone Progress, Tasks Due/Overdue, Time Logged vs Budget, Resource Schedule Heatmap, Billable Utilization, Invoice Status.
3) Map data sources (connect execution to finance)

Your dashboard is only as trustworthy as its inputs. Map each metric to a single source of truth, then keep it there.
- Sources to wire: Tasks & milestones → status/flow; Timesheets & expenses → burn; Resource scheduling → capacity; Invoicing → cash & leakage
- Governance: agree on definitions (e.g., what flips a task to “Done”? what counts as billable?) to avoid misreads
👉 Avaza move: Use role rates and project budgets so Time and Expenses feed Budget and Invoicing automatically—no spreadsheet stitching.
4) Choose the right visualizations (make signal obvious)
Visuals should reduce cognitive load and point to the next action. Prefer counters, trend lines, heatmaps, and traffic lights over dense tables.
Patterns:
- Health at a glance → RAG counters
- Predictability over time → trend lines (on-time %, lead time)
- Staffing pressure → heatmap (role/owner)
- Financial posture → progress bars (actuals vs budget), invoices by status
Anti-pattern: “wall of numbers” with no owner or threshold
👉 Avaza move: Arrange widgets in this order: Status (RAG) → Flow (due/aging) → Capacity (heatmap) → Financials (budget/invoices) → Risks (flags).
5) Instrument alerts you’ll actually act on (guardrails)
Tie each metric to a threshold, an owner, and a playbook. Alerts without DRI + next step become noise.
Recommended thresholds:
- Budget ≥ 80% AND Scope < 60% → PM + Account Owner swarm
- Any Red risk > 7 days → escalate to Program Lead with mitigation plan
- Utilization > 95% for 2 consecutive weeks → reassign or re-estimate
- Milestone > 3 days late → update PoR (new date + owner)
👉 Avaza move: Save filter-based At-Risk views and use @mentions in comments so the alert, discussion, and fix live together.
6) Pilot & iterate (prune to signal)
Run the dashboard with the intended audience for a week. Anything no one looks at gets cut or repurposed.
Cadence:
- Daily (Team): 5-minute glance to unblock
- Weekly (Exec): portfolio review to rebalance capacity and escalate top risks
- Weekly (Client): share a client-safe view via the Client Portal for approvals
Keep/kill rules: If a widget hasn’t driven a decision in two cycles, remove or replace it.
👉 Avaza move: Duplicate views per program/client, so teams keep the same structure while filters change.
7) Configure it in Avaza (end-to-end setup)

Now translate the blueprint into a working, role-specific dashboard.
Widgets to add:
- Milestone Progress (with dependencies exposed)
- Tasks Due/Overdue (filters for 7/14/30 days)
- Aging Blockers (custom field: Blocker Type)
- Resource Schedule Heatmap (by role/owner)
- Time Logged vs Budget (with role rates)
- Billable Utilization (by role/team)
- Expense Status & Invoice Status (by project/client)
Grouping & filters: group by Project, Client, or Owner; filter to current phase/sprint; pin At-Risk/Red/Amber
Saved Views: Team, Executive, Client, same data, tuned summaries
Sharing: publish the Client view via Client Portal; lock internal widgets to staff roles
▶️ See Avaza’s Real-Time Project Dashboard Template
▶️ The Bottom Line
Avaza doesn’t just visualize your operations, it operationalizes your visibility.
It’s the command center where project delivery, resource capacity, and financial performance converge – giving leaders a single, actionable view of every moving part in their business.
For teams that demand both real-time clarity and strategic foresight, Avaza is not just a project dashboard tool “it’s the engine room of intelligent project delivery”.
Try Avaza For Free
If you feel that Avaza might be the right project dashboard software for your digital agency, sign up to start using Avaza for free. If you need any help with your Avaza subscription or want to better understand our pricing, please contact chat support or email support@avaza.com.
2. Wrike — Strong Analytics for Complex Portfolios
Wrike offers a powerful suite of dashboards and analytics suited for large organizations with multi-layered project structures.
Strengths
- Deeply configurable dashboards with advanced widgets and automation rules.
- Mature visualizations, including Gantt timelines, workload charts, and health RAGs.
- Great for cross-departmental reporting and governance-heavy setups.
Weaknesses
- Steeper learning curve and setup overhead for smaller teams.
- Limited native financial or invoicing capabilities—requires integrations.
▶️ Verdict
Excellent for enterprise PMOs or complex matrix organizations. But for mid-size agencies or firms seeking integrated time, expense, and billing dashboards, Avaza delivers a more unified, out-of-the-box experience.
3. ClickUp — Flexible Work Management for Agile Teams
ClickUp thrives on flexibility, making it a favorite for agile product and engineering teams looking to create customized dashboards.
Strengths
- Powerful custom fields, automation, and multi-view options (list, board, calendar, Gantt).
- Competitive pricing for startups and growing teams.
Weaknesses
- To achieve real financial and resource visibility, integrations or external connectors are required.
- Lack of governance can lead to inconsistent data structures across workspaces.
▶️ Verdict
Ideal for tech-driven teams needing adaptable workflows. However, for structured PSA environments—where billing accuracy, utilization rates, and resource forecasting matter—Avaza offers stronger native control and financial depth.
4. Monday.com — Intuitive Visuals for Growing Teams
Monday.com is often the first step teams take when upgrading from spreadsheets. It’s visually engaging and simple to adopt, perfect for creative or marketing agencies focused on collaboration and progress visibility.
Strengths
- Beautiful interface and color-coded boards that simplify project tracking.
- Wide range of templates for onboarding and delivery workflows.
- Automation rules for recurring updates and reminders.
Weaknesses
- Limited financial depth: Time, billing, and budget tracking need add-ons or integrations.
- Resource management is surface-level—no robust utilization forecasting.
▶️ Verdict
Monday.com offers clarity for visual thinkers but stops short of end-to-end operational control. Avaza extends that clarity into finance, utilization, and client transparency, making it more powerful for professional services teams.
5. Scoro — Enterprise-Grade PSA Alternative
Scoro positions itself as an all-in-one business management suite for large consulting and professional services organizations.
Strengths
- Deep integration between projects, resources, CRM, and finances.
- Excellent portfolio-level dashboards with powerful analytics.
Weaknesses
- Higher price point and complex implementation.
- Requires longer onboarding before teams reach full productivity.
▶️ Verdict
Scoro is a strong enterprise PSA competitor, but Avaza wins on usability, affordability, and agility. For small-to-mid-sized teams wanting fast deployment and a gentle learning curve, Avaza delivers enterprise-grade functionality—without enterprise friction.
6. Asana — Simplicity and Adoption at Scale
Asana is known for its clean design and user-friendly task management—great for internal coordination and marketing or creative workflows.
Strengths
- Highly intuitive interface, minimal training required.
- Effective for task visibility and lightweight reporting.
Weaknesses
- Missing PSA components like time tracking, invoicing, and resource utilization
- Difficult to scale for client-based delivery or financial oversight.
▶️ Verdict
Asana is ideal for small, internal teams. But for professional services firms where time equals revenue, Avaza offers the complete stack—tracking both productivity and profitability in one system.
The Anatomy Of a High-Signal Project Dashboard (Key Features Smart Teams Rely On)
A modern project dashboard isn’t just a reporting layer “it’s your early-warning system and decision cockpit”.
For busy Project Managers, Operations Directors, and Department Heads, it’s the difference between reacting to chaos and managing with foresight.
The most effective dashboards balance snapshot clarity (what’s true right now) with flow intelligence (how work is moving over time).
They don’t overwhelm with charts whether they distill what matters: risk, velocity, and outcomes.
Below, we break down the six core elements every high-signal project dashboard should include, and how Avaza makes each one actionable in real time.
1. Schedule Health — Are We Truly On Track?
Even well-planned projects can drift quietly before anyone notices.
A strong dashboard should make the true schedule health visible “showing where milestones are on track, where buffers are shrinking, and what’s heading for red”.
What to Track:
- Percentage complete per phase or milestone
- RAG (Red/Amber/Green) status indicators
- Critical path tasks and upcoming deadlines
- Slack or buffer time remaining
How to Read It:
- Green but shrinking buffer → Monitor closely
- Amber with <3 days of buffer → Add capacity or re-plan
- Red → Immediate intervention and scope reset
▶️ In Avaza:
Add Milestone Progress and Next 14 Days widgets. Dependencies automatically surface your critical path, and a client-safe “Milestones Only” view keeps status updates clear and focused.
2. Flow & Blockers — Where Is Work Getting Stuck?
Your workflow tells the truth about productivity. When tasks stall or cycle time rises, you can expect delays later.
Flow metrics expose those invisible slowdowns before they derail delivery.
What to Track:
- Tasks due this week
- Work-in-progress (WIP) limits
- Blocker aging (>3 or >7 days)
- Task handoffs between teams
- Throughput (tasks completed/week)
How to Read It:
- Rising cycle time but flat throughput → Bottleneck ahead
- Blockers aging beyond 7 days → Risk of schedule slip
▶️ In Avaza:
Combine Tasks Due/Overdue with Aging Blockers filters. Visualize handoffs using board columns, tag blockers by type, and review bottlenecks directly in team dashboards.
3. Ownership Clarity — Who’s Accountable For What?
Projects collapse when accountability is unclear.
Every deliverable needs a Directly Responsible Individual (DRI) and supporting SMEs (Subject Matter Experts).
What to Track:
- DRI per deliverable
- Unassigned work
- Frequent reassignments (>2 per week)
How to Read It:
- Missing DRIs → Expect confusion and delays
- Reassignments → Possible leadership gap or unclear scope
▶️ In Avaza:
Group tasks by Assignee and filter for Unassigned items. Add DRI and SME fields in task templates, so ownership is explicit from the start.
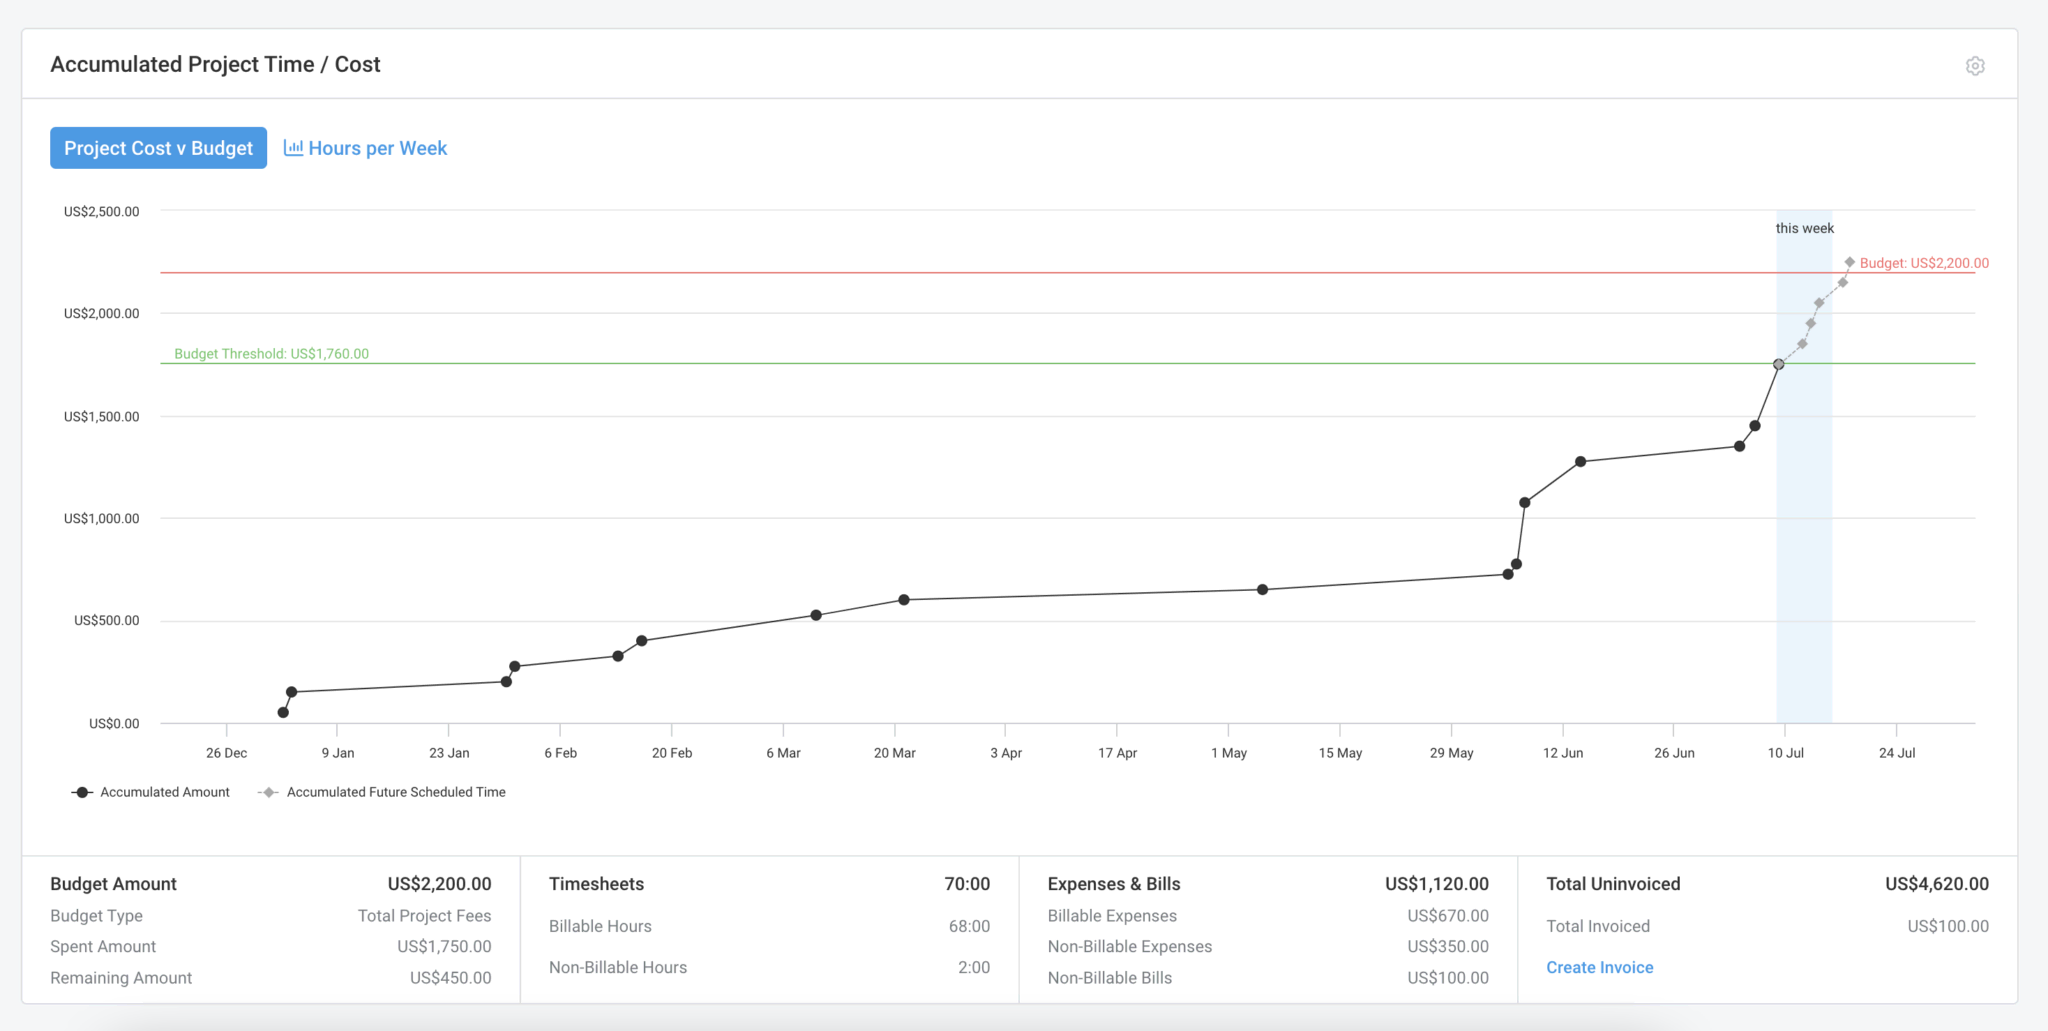
4. Budget & Time — Are We Burning Predictably?
Profitability and progress move together.
A healthy dashboard should tell a single, connected story between time, cost, and scope.
What to Track:
- Actuals vs. budget
- Time logged vs. estimate
- Burn rate trends
- Billable vs. non-billable hours
- ETC (Estimate to Complete)
How to Read It:
- Budget ≥80% with <60% scope complete → Possible overrun
- Non-billable spikes → Rework or unclear requirements
▶️ In Avaza:
Pair Time Logged vs. Budget with Expense and Invoice Status widgets. Avaza automatically calculates live margins using role rates, giving you real-time visibility into profitability.
5. Quality & Predictability — Can We Deliver Without Surprises?
Predictability builds trust with clients and internally.
Quality metrics reveal whether your system delivers cleanly or repeatedly cycles back into rework.
What to Track:
- On-time completion rate
- Reopen rate
- Scope change frequency
- Lead time (request → done)
- Defect escape rate
How to Read It:
- Stable on-time + declining lead time = healthy workflow
- Reopen rate >15% = unclear Definition of Done or weak QA process
▶️ In Avaza:
Use Done vs. Reopened and Lead Time Trend widgets. Add acceptance checklists (criteria, QA, client sign-off) to standardize what “done” means across teams.
6. Capacity & Utilization — Are People Balanced And Productive?
Predictable delivery depends on balanced teams.
A good dashboard highlights resource utilization showing who’s overloaded, who’s underused, and where the next bottleneck will form.
What to Track:
- Resource heatmaps by skill or role
- Over- and under-utilization
- Forecast vs. actual workload
- Time-off and conflict overlaps
How to Read It:
- Repeated overload = risk of burnout and schedule slippage
- Under-utilization = idle capacity or unclear pipeline
▶️ In Avaza:
Avaza’s Resource Scheduling lets you forecast weeks ahead, visualize heatmaps, and rebalance workloads with drag-and-drop ease. Export the schedule for exec review, but keep Avaza as your single source of truth.
Guardrails That Trigger Action, Not Noise
Dashboards are only powerful when alerts mean something.
Define thresholds that actually drive action and tie each alert to an owner.
💡 Example Thresholds:
- Budget ≥80% + Scope <60% → Escalate to PM & Ops Lead
- Any Red risk >7 days unaddressed → Escalate to Program Lead
- Utilization >95% for 2+ weeks → Redistribute workload
- Milestone >3 days late → Require new Plan of Record
In Avaza: Attach these thresholds to Saved Views, and use @mentions in task comments so the alert and the fix stay together.
How Does A Project Status Dashboard Work (And Who Needs It)?
A project status dashboard is a live, unified view that pulls data straight from execution layers “tasks, time tracking, expenses, and resource schedule” and fuses them with portfolio context.
It blends snapshot metrics (e.g., % complete, milestone health) with flow metrics (e.g., tasks due this week, blockers aging >7 days) and financials (e.g., actuals vs budget, billable vs non-billable mix).
The result is role-appropriate visibility for team leads, executives, and clients—each seeing the same truth at the right granularity, from tactical unblocking to portfolio governance.
💡 Pro tip (Avaza): Because Avaza’s dashboards sit on a unified stack—projects & tasks, time, expenses, resource scheduling, client portal/chat, and invoicing—you get real-time, drillable views without stitching spreadsheets or maintaining brittle integrations.
👉 Who needs project dashboard software—and when
- Digital agencies & consultancies: Track multi-client deliverables, visualize billable vs non-billable time, and monitor budget burn vs scope (especially for retainers).
- Professional services & product teams: Coordinate cross-team initiatives, manage dependencies, and balance capacity to prevent over/under-utilization.
- Ops leaders & department heads: Roll up portfolio health for QBRs and exec reviews, no manual slide-wrangling, just live metrics and trends.
👉 Buying trigger: If you’re running multiple projects or cross-team workflows and relying on ad-hoc updates or siloed apps, you’re flying blind. A real-time dashboard establishes a shared source of truth, enabling predictable outcomes and faster, evidence-based decisions with Avaza as the simplest path to get there.
Team vs Executive vs Client dashboards—What’s The Difference?
- Team dashboard (daily/weekly): Tactical view like current sprint/phase, blockers, assignments today/this week.
▶️ Click here to see the template
- Executive dashboard (weekly/monthly): Portfolio roll-up—trend lines for delivery predictability, margin/leakage, capacity utilization, and risk clusters across programs.
▶️ Click here to see the template
- Client dashboard (weekly): Scope/milestones, budget burn, decisions/approvals needed—transparent, no internal noise.
▶️ Click here to see the template
Use Cases: How Smart Teams Apply Project Dashboards
Dashboards aren’t just reporting tools, they’re live control centers for modern operations. Whether you’re managing retainers across dozens of clients, delivering fixed-fee services, or launching cross-functional SaaS products, dashboards turn visibility into action.
Let’s look at how different teams use project dashboards, and how Avaza turns these insights into predictable delivery and profit.
1. Agencies: Managing Retainers & Creative Production
For agencies, every hour and approval impacts profitability. Managing multiple clients means maintaining clarity on delivery timelines, billable utilization, and creative throughput.
A strong dashboard helps agencies visualize their operational pulse – revealing where time is going, which retainers are burning faster than expected, and which projects need executive attention.
Typical focus areas include:
- Retainer burn vs. scope completed
- Billable utilization by role or department
- Approvals pending from clients
- Blocker aging and turnaround rates
With Avaza, these insights come together seamlessly. By connecting time tracking, expenses, and invoicing within one platform, agencies can see real-time profitability and automate client-ready reporting.
Plus, with client-safe dashboards shared via Avaza’s portal, account managers can skip manual updates and let clients self-serve status anytime without compromising internal data.
2. Professional Services: Controlling Fixed-Fee Implementations
Professional services firms face a different challenge: maintaining delivery quality while protecting scope and margin. In fixed-fee projects, one untracked change request or scheduling delay can turn a profitable engagement into a loss leader.
That’s where a project dashboard becomes a tactical control system.
It gives delivery leaders a single lens to monitor milestone progress, resource capacity, and phase variance in real time.
Key dashboard elements include:
- Milestone traffic lights and schedule variance indicators
- Risk aging and unresolved dependencies
- Open change requests or client approval delays
Avaza brings clarity by connecting project tracking with resource scheduling and alert automation. When effort variance crosses 15% or a milestone drifts off track, Avaza triggers proactive alerts.
Leads can then reassign workloads, re-forecast budgets, or flag scope risks — all before they hit the client.
3. SaaS Product Teams: Coordinating Cross-Functional Launches
In SaaS organizations, launches often span multiple departments — marketing, engineering, success, and operations — each with their own priorities. Without shared visibility, dependencies slip, blockers multiply, and timelines blur.
A project dashboard aligns every stakeholder around a single truth.
From product readiness to go-live dependencies, teams can track how each stream contributes to the overall launch goal.
Common metrics and visuals include:
- Critical path visibility and dependency risk tracking
- Workstream ownership clarity across teams
- Bug burndown trends and QA velocity
- Milestone countdown to launch
With Avaza, SaaS teams can blend project and task widgets into milestone-driven dashboards that evolve as the launch nears. Executives get their own weekly summary view, while product managers monitor daily readiness across teams.
The result? Fewer surprises, faster decisions, and launches that stay on track.
Frequently Asked Questions
What’s the difference between a project tracking dashboard and a project status dashboard?
A tracking dashboard emphasizes in-flight execution (tasks due, assignments, time logged). A status dashboard adds the narrative—milestone health, risks, and financials—so stakeholders see both “what’s happening” and “what it means.” In practice, you’ll combine both in one view.
Which metrics matter most for executive project dashboards?
Executives care about predictability and performance at scale: on-time delivery trend, margin/leakage, utilization by role, risk clusters, and customer health. Keep the widget count lean, show trends, and link to drill-downs.
Can I use a project dashboard for program/portfolio management?
Yes. Group by client, program, or department to see cross-project risk and capacity. Portfolio dashboards help you rebalance resources and spot systemic issues early.
How do project dashboards support billing and cash flow?
If your dashboard is connected to time tracking and expenses, you can watch actuals vs budget in real time and streamline invoicing—especially for retainers or T&M work.
Final take
Project dashboards have evolved far beyond static status reports, they’ve become the command centers of modern work. In an era defined by distributed teams, tighter margins, and faster delivery cycles, real-time visibility isn’t optional; it’s a competitive edge.
Whether you’re an agency balancing retainers, a professional services firm managing client portfolios, or a SaaS team preparing your next product launch, the principle remains the same: you can’t improve what you can’t see.
💡 That’s where Avaza redefines the playing field.
It doesn’t just visualize data as it unifies it. Projects, time tracking, resources, budgets, and collaboration all flow into one intelligent workspace. Every update, every metric, every decision is powered by live, connected data.
With Avaza’s dashboards, you’re not just reporting on progress, you’re predicting outcomes, optimizing performance, and managing smarter.
So the next time your team asks, “Where do we really stand?” — you’ll already have the answer, live on your dashboard.
💡 Ready to experience it?