Are we going over our time estimate?
Many professionals & teams track their time, and would like to monitor how close Tasks & Projects are to using up their Time Budgets and Estimated Hours.
Visualizations to the Rescue!
To make your life easier, we now have visualizations at Project, Task level, and on any ad-hoc Task Grouping (e.g. when grouping tasks by Priority, Section, Assignment etc) so you can quickly see your progress.
Here’s how the indicator looks on the Task List:


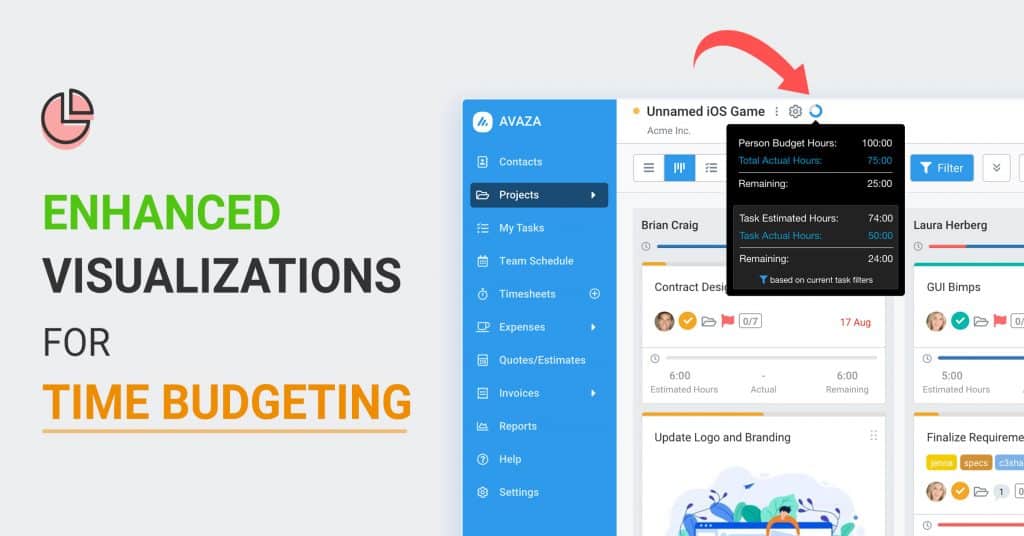
Here’s how they look on the Kanban:


Quick Filtering
The progress widget displays the data based on applied filters. For example, if the status filter is applied to only view tasks with a status of “Not Started” then the widget would only display task estimate and actual time tracked for tasks in “Not Started” status. So it’s super powerful!
Project level Time Budget usage visualization
In addition to displaying the time usage indicator at task and grouping rows, we have also introduced the indicator at Project level so project members with timesheet access and project managers/administrators can quickly evaluate the overall time-health of the project.


The time widget at project level adapts based on the defined budget type and task estimated hours to provide the most relevant information.
Here are a couple of examples that you may find useful.
Project List View Grouped by Section
To quickly scan a list of Sections (these could represent your Sprints/Milestones) for a particular project follow the steps below.

- Open an existing project task page in list view.
- Select grouping by Section
- Collapse the sections by clicking the expand / collapse button
- Scroll through the list to find sections where
- Tracked time is nearing the task estimate (tracked time indicated by blue color)
- Tracked time is over the task estimate (tracked time exceeding the estimate indicated in red)
- Mouse over the widget to see total estimated hours, actual hours tracked on tasks and remaining hours.

Next, expand the section to see the task-level details and followup with team members that are nearing or over the task estimate
Project KanBan View Grouped by Assigned To
Similar to the task list view, KanBan view displays the time widget as line progress graph for each grouping column that has either task estimate or actual tracked hours.

- Open an existing project task page with KanBan view.
- Select grouping by Assigned To
- Expand all the sections by clicking the expand / collapse button
- You can see the widget data for each project member and tasks assigned to each member that are contributing to the totals.
- Followup with team members that are near or over the task estimate.
We hope you enjoy this new feature and look forward to your feedback!
Best wishes,
The Avaza Team
4 Comments
Great addition! This is going to be very useful.
Awesome feature!
Very useful feature. I look forward to implementing it in my workflow.
This is brilliant!
Is there a way to add project/section due dates and expense tracking to these areas? That would be so good