One of the updates to the Project Management Module is the addition of a Project Summary page. Users have often asked if there was a way they could get a quick overview of one project, without having to run reports, and we hope this page will meet those requirements.
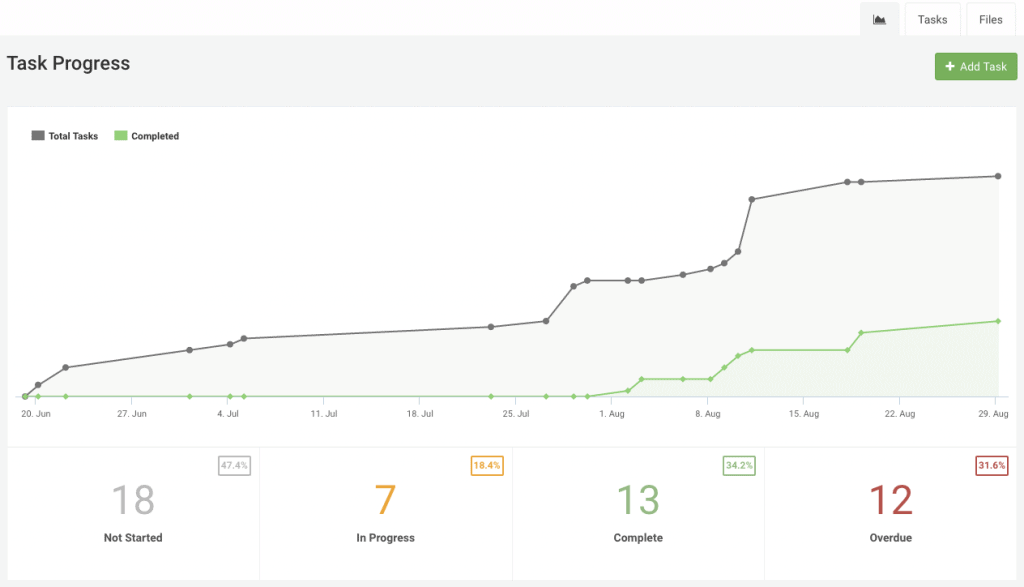
The Project Summary page allows you to get a quick overview of task status for a particular project, as well as review the rate of tasks being completed versus the total tasks. These stats, and graphs (shown below), can also help you quickly ascertain projects that might be in danger of not getting completed on time.
To access the Project Summary page, click on the first tab above the +Add Section option in any of the project views (list-view or Kanban).

Figure: Access Project Summary Page
Information Displayed on Project Summary Page
The Project Summary page is a quick way of accessing information regarding how fast your project is getting completed. You may have 100 tasks assigned to 10 different team members, which would make it hard to get a grasp on exactly where your project stands from just the list-view or Kanban view of the project tasks.
The Project Summary page shows you a graph comparing the rate at which tasks are being added versus the rate at which tasks are being completed. It also shows you what the stats are for tasks not yet started, in-progress, completed and overdue.

Figure: Project Summary Page
Rate of Tasks Completed vs. Total Tasks
Tasks are the heartbeat of Avaza, and how you get your project to completion. So it stands to reason that you should have a quick way of checking how fast your team is completing tasks and compare it with the rate you are adding tasks to the project.
The main graph on the Project Summary page shows exactly this.
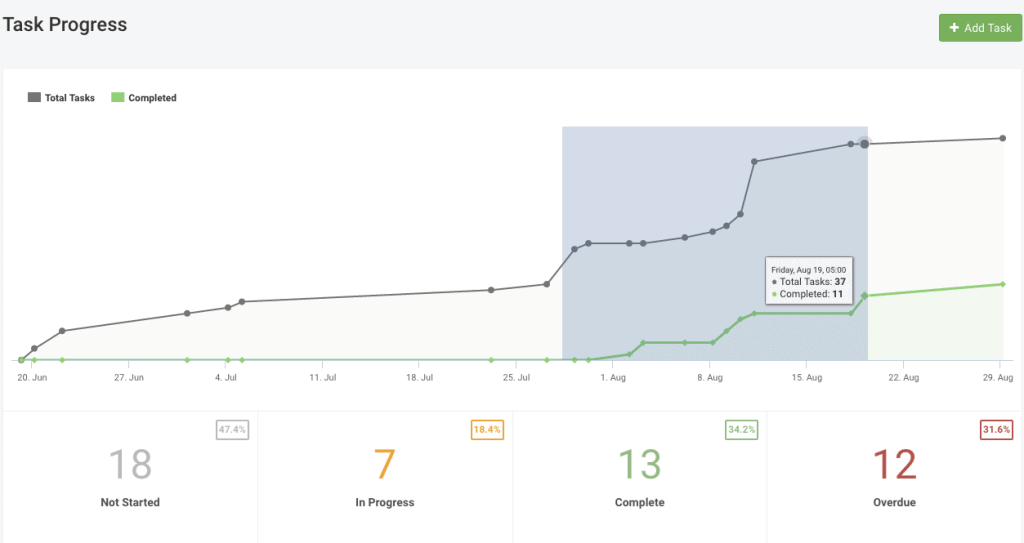
On both mobile and desktop, you can zoom in to see stats of a particular time period. Just drag your cursor over the dates you are interested in.

Figure: Quickly Zoom In
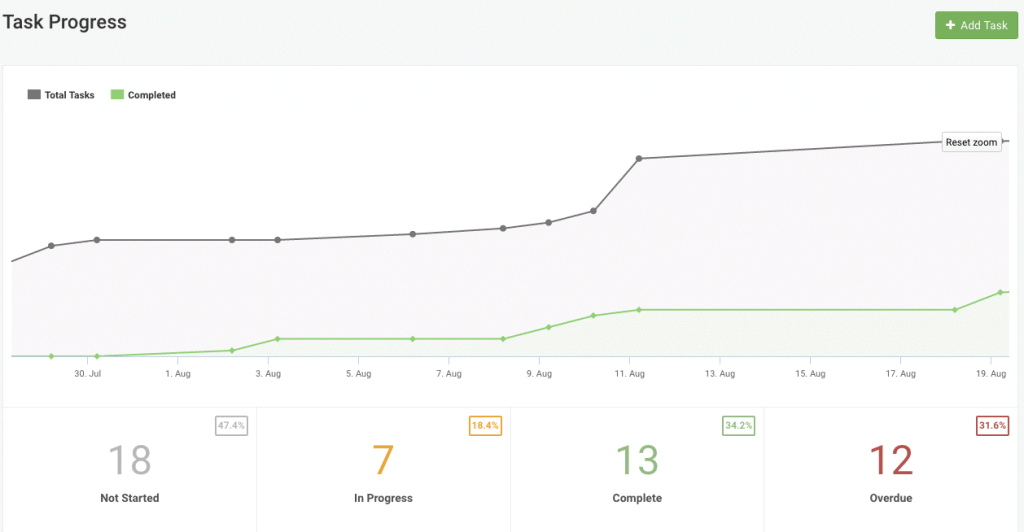
Once zoomed in, you can see more details on the graph for the specific date range you have chosen. Reset back to the default view by clicking Reset Zoom.

Figure: Zoom In For More Clarity
Stats on Task Status
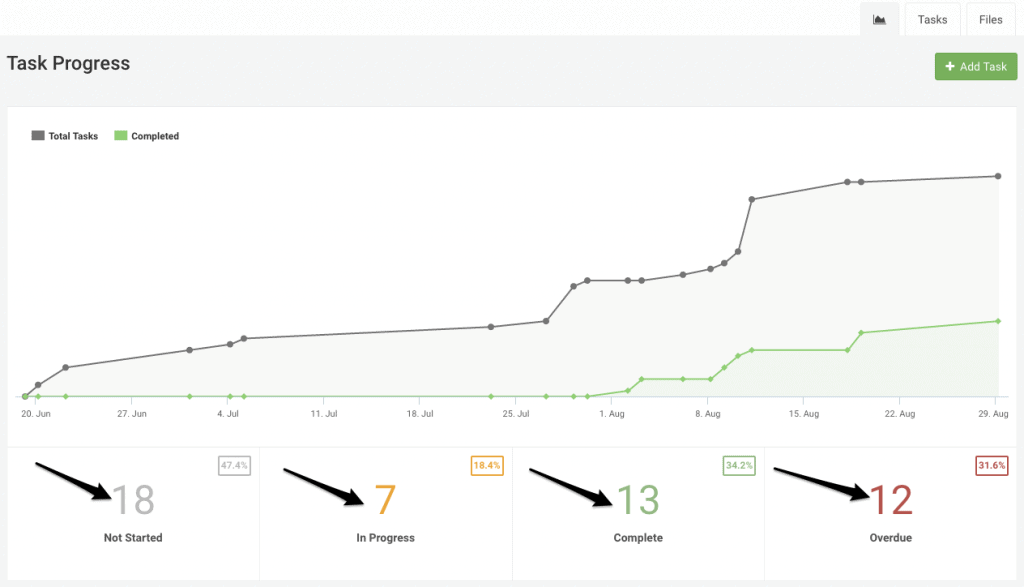
The Project Summary page also shows you stats for tasks Not Started, In Progress, Complete and Overdue, which is a wonderful way to get a quick overview of how much of the project is complete.

Figure: Stats on Task Status
Clicking on each of these stats will take you to the task list-view, where the tasks will already have been filtered for that status. So if you see that 13 tasks have been completed, you can then also check which 13 tasks have been marked completed.
The Project Summary page is a quick way to access basic information on one project without having to run a report. We will soon be adding Financial Summary and Activity Feed information to this page as well. Till then, we hope you enjoy the current update! Please let us know your thoughts in the comments.
