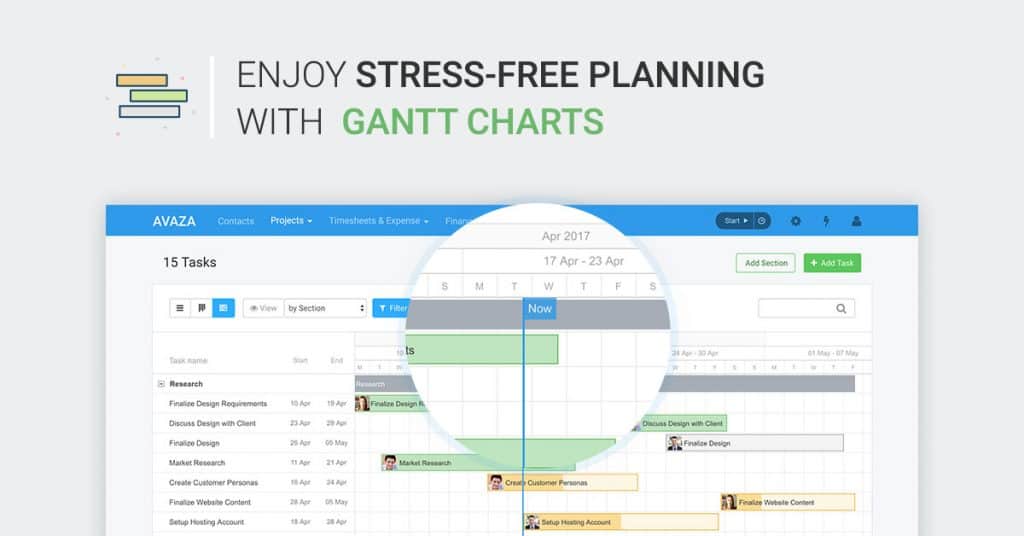
Visualize project timelines with Avaza Gantt charts. View progress made on project tasks and their start and due dates on a timeline to better understand how your project is doing.
Our Gantt charts can be used interchangeably with the existing project management views in Avaza: Task List and Kanban Board.
Using Gantt Charts in Avaza
While working in Gantt Chart view, you can apply all the same groupings and filters as in other project views.
Project tasks now have a start date field in addition to the due date and completed date fields. Only tasks with both start and due dates will be added to the Gantt timeline.

One exciting feature that is an industry-first is that Gantt Chart view is also available for My Tasks. You can now view all your, or another user’s, tasks on a Gantt, and better understand how their workload looks for the coming days.

Important Elements in Gantt
To better understand a Gantt Chart, you need to understand what you’re seeing on the screen.
Here are all the elements currently included in Avaza Gantt Charts.
1. Zoom-Level
The zoom-level at the top of the Gantt Chart allows you to view tasks by Month, Week or Day. The length of the task on the Gantt timeline is relative to the zoom-level you choose.

Months
Long-running projects, running over a few months, can be best viewed at the Month zoom-level.
When viewing a Gantt zoomed at Month-level, the top bar of the timeline (major scale) will display the month and year, while the second bar (minor scale) displays a specific week in that month.

Weeks
While viewing tasks zoomed at Week-level, there are three scales. The first one shows the month and year, the second shows the week, and the third shows day of the week.

Day
The lowest zoom option is Days, which allows you to not only see the day on which tasks are due, but the time at which the task is set to start and end as well. At this level, the first bar shows day and date, while the second shows 6-hour intervals.

2. Tasks on the Gantt
You can double-click on any task to open the Task Edit Popup. Dragging the task from either end allows you to change its start or due date. Tasks can also be dragged and moved to a different time period if required.
The percentage complete field is used to denote task progress, which is shown as shading on the bar. You can drag the task progress bar to increase or decrease the percentage complete.

We also display the user profile picture of the assigned-to person for each task.
3. Section Length
All Sections are displayed on the timeline based on the length of the tasks under them. Section length automatically updates to include all tasks in that section.

4. Current Date
There is a vertical line marker showing current date, so you always know when tasks are starting or due in context.

Coming up in Gantt
We’re not quite done with Gantt charts. In the coming months, we will be launching Task Dependencies as well as Auto-Scheduling of dependent tasks.
Do let us know your thoughts about this new feature in the comments. 🙂
4 Comments
the gantt chart does not print clearly when exported. WE need to select which parts of the gantt chart or over how many pages so it can be shared with clients as PDF and still be legible. The yellow cannot be ready, a gantt chart over one pages is squashed and the print is not clear or dark enough, thanks
Hi Carley, do you mind sending an exported PDF of the Gantt with issues to support@avaza.com. We will make sure the product team looks into it further.
can gantt chards be downloaded once made as a pdf? or excel sheet?
Yes, Gantt charts can be downloaded in PDF format. Click the PDF button next to the Filter button above the Gantt chart.