Finish Q4 Strong: Avaza Account Dashboard for Business Visibility

Table of Contents

Introduction

Q4 compresses timelines. Holidays, slower approvals, and end-of-year juggling make it easy to miss the signals. Avaza’s Account Dashboard turns your home screen into a control room: a flexible grid of widgets you can add, remove, resize, and rearrange to fit your role – whether Owner, Ops, PM, or Finance. You can configure it once, review it weekly, and protect your quarter.

Avaza Account Dashboard with customizable widgets

What the Avaza Account Dashboard is (and isn’t)

Core building blocks: widgets you’ll use first

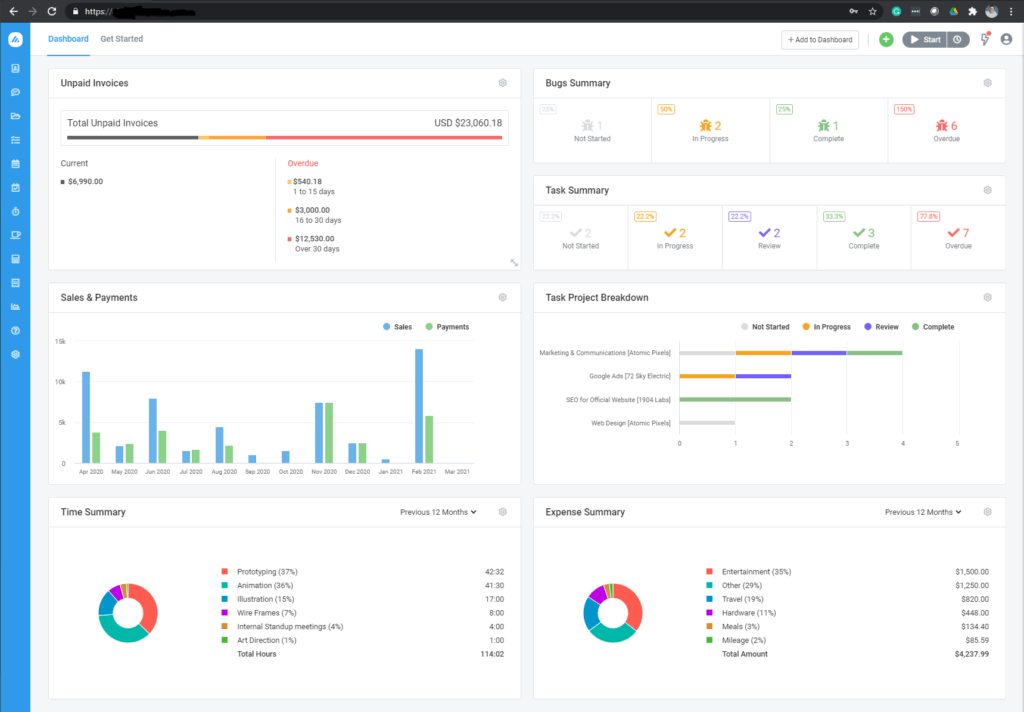
Avaza ships with a library of widgets you can drop into your grid. Popular starters include:

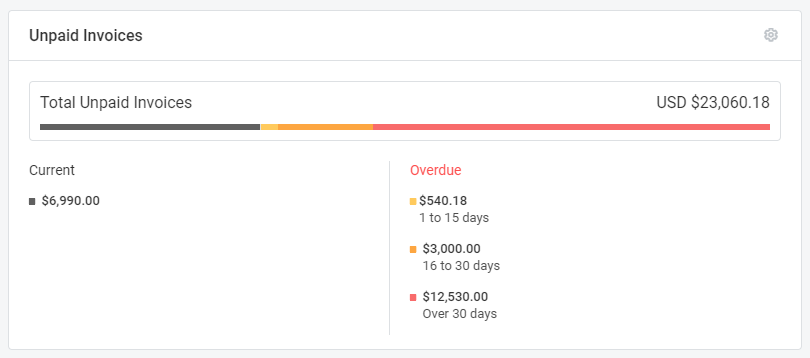
  • Unpaid Invoices / Sales vs Payments – see receivables and collections at a glance. 

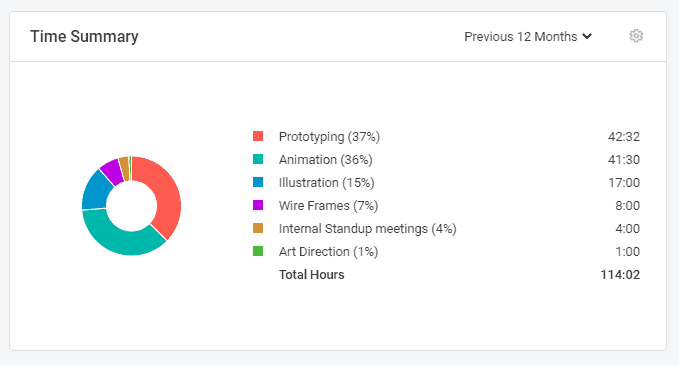
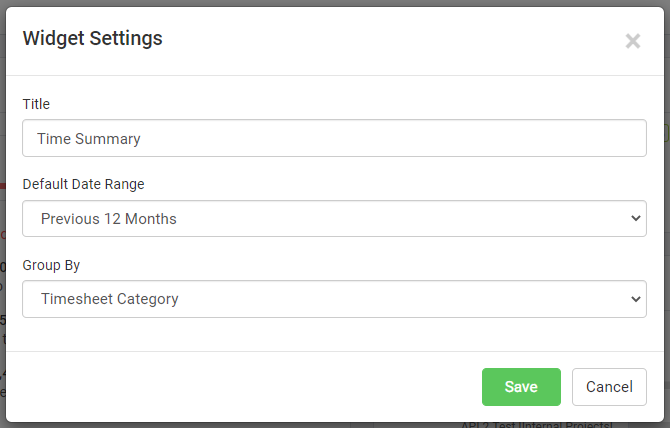
  • Timesheet Summary – track billable time by person or project to catch utilization dips. 

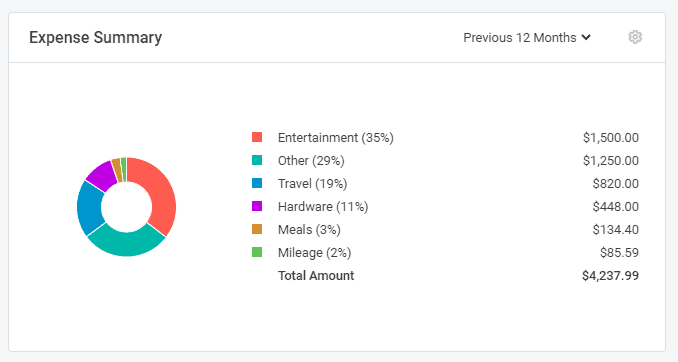
  • Expense Summary – watch spend patterns by category. 
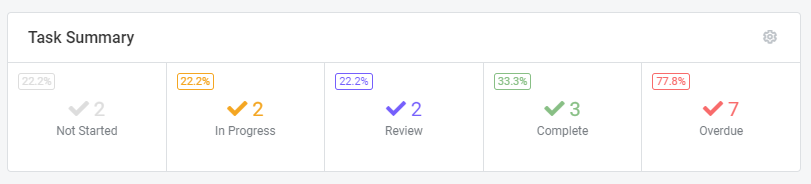
  • Recent Projects / Task & Bug summariesjump back into active work and monitor status distribution. 

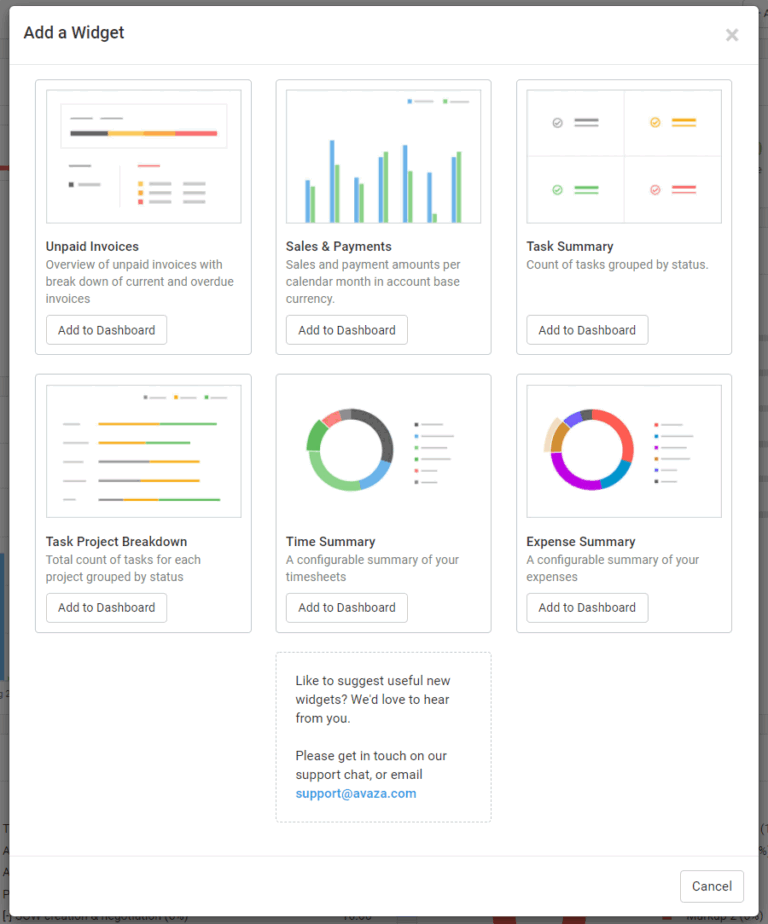
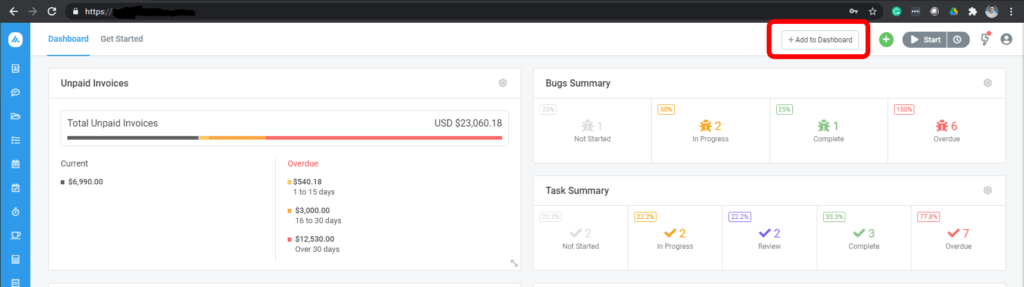
Tip: Click Add to Dashboard to open the widget library, then use the widget’s cog to set filters/grouping for that instance.

Set it up in 5 minutes (step-by-step)

  1. Open your Dashboard and hit Add to Dashboard. 

  2. Drop 4–6 essentials (see list above). Keep it lean; you can expand later. 
  3. Resize & arrange so the most important metrics sit top-left. 
  4. Rename widgets to reflect your use cases (e.g., “AR >30d”). Add duplicates with different filters. 


Save your layout
and make it a Monday ritual: review, decide, act.

Role-based starter layouts (copy-paste ideas)

Owner/GM view

  • Unpaid Invoices (filter: overdue)
  • Sales vs Payments (this month)
  • Timesheet Summary (billable vs non-billable)
  • Expense Summary (this month)
  • Recent Projects
    Goal: protect margin and cash timing.


Ops/Resource lead

  • Timesheet Summary (team grouping)
  • Task Summary (status distribution)
  • Recent Projects
  • Sales vs Payments (trend)
    Goal: rebalance capacity before projects slip.

Project manager

  • Task Summary + Bug Summary (per project)
  • Timesheet Summary (project view)
  • Recent Projects
    Goal: unblock execution and keep scope tight.

Finance/AP/AR

  • Unpaid Invoices (age buckets)
  • Sales vs Payments (monthly)
  • Expense Summary (category trend)
    Goal: accelerate collections, curb leakage.

Note: Each layout is created by adding, renaming, and filtering multiple widgets; you can add more widgets over time as the gallery grows.

Turn signals into action (weekly cadence)

  • Cash stuck? Drill into Unpaid Invoices, trigger reminders, or book a collections sprint. 
  • Utilization dipping? Reassign work; adjust scheduling before revenue slips. 
  • Costs creeping? Use Expense Summary to spot categories spiking month-over-month. 
  • Projects stalling? Scan Task/Bug summaries, clear blockers, and reset timelines. 

Power tips

  • Multiple instances = multiple lenses. Add the same widget twice with different filters (e.g., AR by age vs by customer).
  • Name your widgets clearly. The title should state the question it answers (“Overdue AR >30d”). 
  • Keep the grid tight. More widgets ≠ more clarity. Start small; expand as you build the habit.

FAQs

Can every user customize their dashboard?
Yes, each user can tailor their own widget layout, sizes, and positions. 

Can I duplicate widgets or add more than one of the same type?
Yes – add multiple instances and rename them to reflect different filters. 

Where do I find new widgets?
Click Add to Dashboard to open the widget gallery; we continue to expand it over time. If you need something specific, email support and suggest it.

Build your Q4 control room in Avaza.

Start with 4–6 widgets, review them every Monday, and keep the quarter on track.

Leave a Comment

Your email address will not be published. Required fields are marked *